


filmQA pro™ panel overview
skip to: image comparer panel
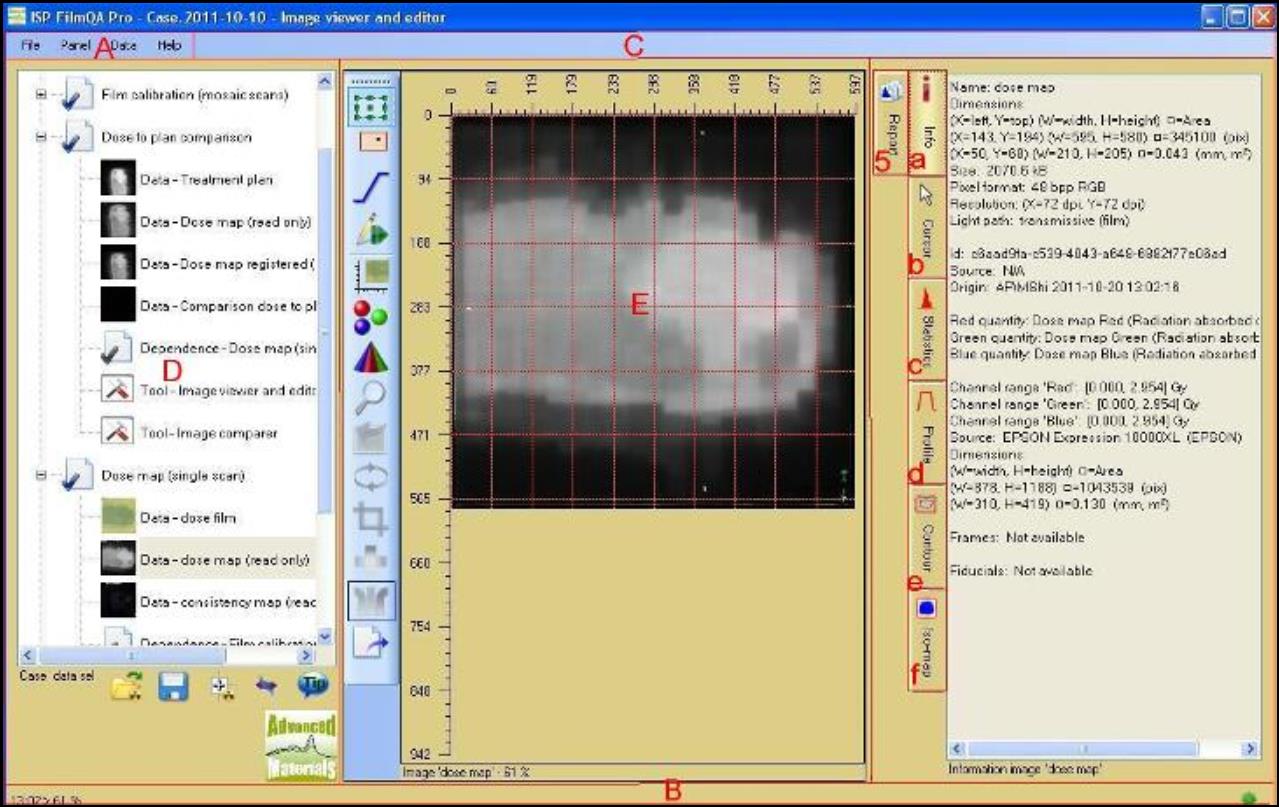
image view and edit panel
menu · status bar · Padding · case data selector · image panel · film evaluation panel · calibration tool panel · scanner linearization panel
To save, open and select the preferred configuration, units, or panels and to generate license data.
a. menu

The Menu bar in filmQA pro™ allows you to save, open and select the preferred configuration, units, or panels and to generate license data.
Select "File", and then:
- “Load treatment case from file” to load the treatment case that’s previously saved.
- “New empty case” to close the treatment case in “Case Data Selector.”
- “Save treatment case as...” to save the treatment case opened as a different file.
- “Recent treatment cases” to open treatment cases that’s recently used.
- Select “Configuration” to load, reload, and save the configuration of the program.
- Check or uncheck the “Auto save” option to save the configuration automatically each time you exit the application.
- Check the “Reload last case with configuration” option to have the treatment case opened with the same configuration that was set last time the case was opened. Uncheck the option to have the case opened with current system configuration.
- Select “Reset to default” to reset the configuration to system default.
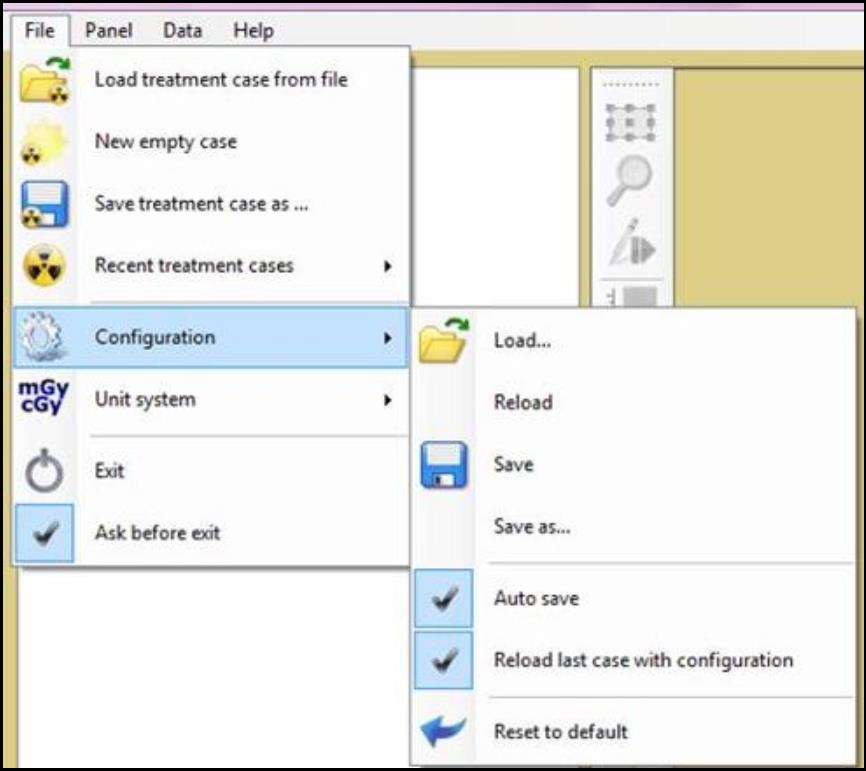
- Select “Unit system” to load, reload, and save the unit preference set by you.
- Check or uncheck the “Auto save” to save the units automatically each time you exit the application. *
- Check or uncheck the “Load unit standards only” to load only the units set as “standard” and exclude the loading the format of numbers.
- Select “Reset to SI” to reset all the units to SI (International System) format.
- Select “Exit” to close filmQA pro™.
- Check “Ask before exit” to have a window pop up asking whether you want to close filmQA pro™ when the “Exit” button is clicked.
Select "Panel", and then:
- Select “Image viewer and editor” to have “Film Evaluation Panel” opened.
- Select “Calibration tool” to have “Calibration Tool Panel” opened.
- Select "Tool management" then
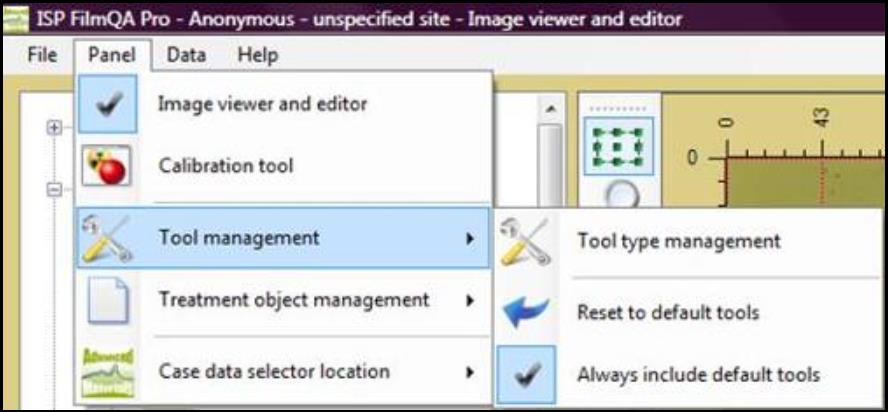
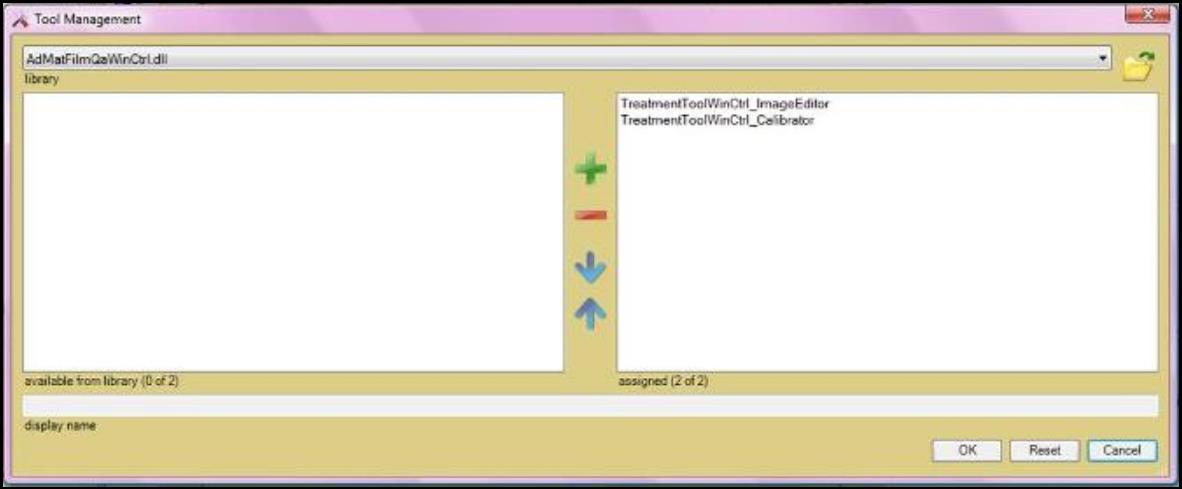
- Select “Tool type management” to open the “Tool Management” window. The window allows you to select the tool set that’s available in the software.
- Select “Reset to default tools” to reset the tool set to system default.
- Select “Always include default tools” to include the system default tool set at all time.
- Select “Tool type management” to open the “Tool Management” window. The window allows you to select the tool set that’s available in the software.
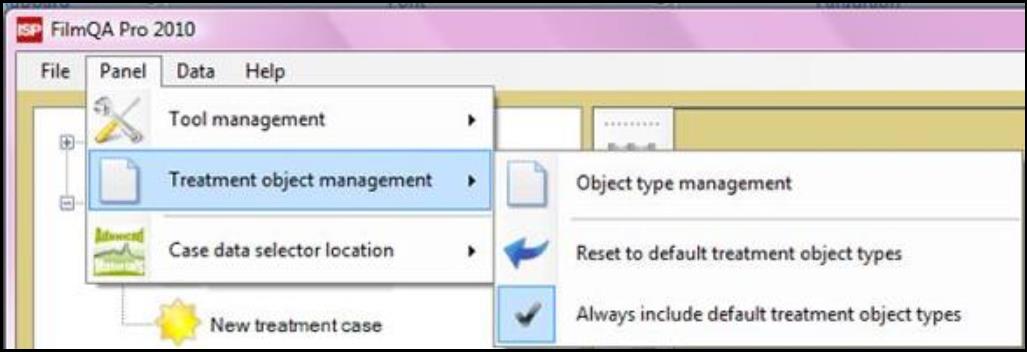
- Select “Treatment object management” then
- Select “Object type management” to open the “Object Management” window. The window allows you to select the objects that are available in the drop down list.
- Select “Reset to default treatment object types” to reset the object list to system default.
- Select “Always include default treatment object types” to include the system default object list at all time.
- Select “Case data selector location” to change the location of the “Case Data Selector.”
Select "Data", and then:
- Select “Patient data” to open the "Patient Data Window" The window allows you to add or remove patient data and to create patient list.
- Select “Treatment case data” to open the “Case Data Window.” The window allows you to add or remove treatment case data and to create case lists.
- Select “Scanner data” to open the “Scanner Data Window..” The window allows you to add or remove scanner data and to create scanner lists.
- Select “Units” to open “Units Window.” The window allows you to change the setting and format of units in the software.
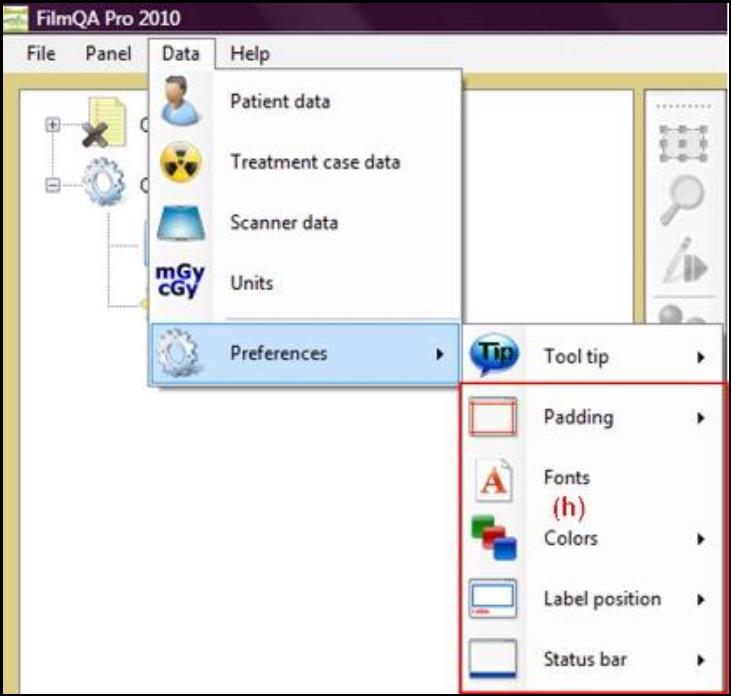
- Select "Preferences" and
- “Tool tip” to hide or show all the tool tips in the software.
- See detailed description for functions of options in box (h) in “Padding” panel.
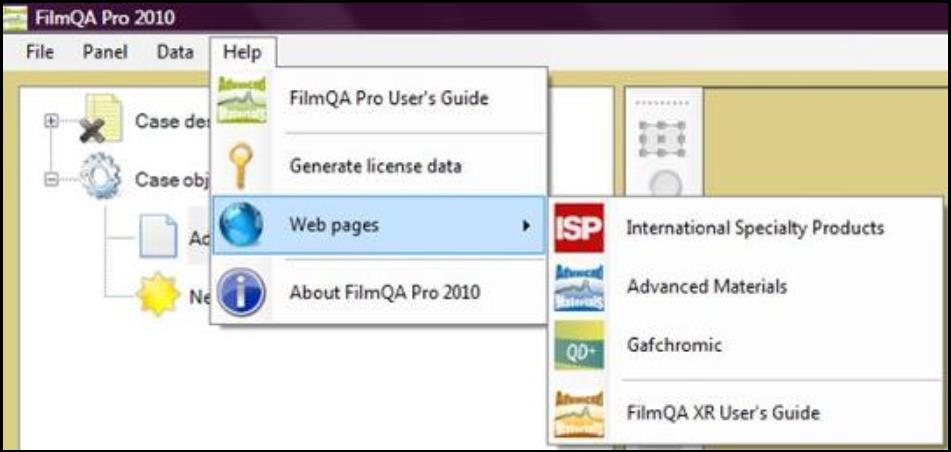
Select "Help" and
- Select “FilmQA Pro User’s Guide” to view the user manual of the software.
- Select “Generate license data” to save or copy the license data. For details of how to obtain a license key for FilmQA™ Pro, see “Installation.”
- Select “Web pages” to view the websites related to this software.
- Select “About FilmQA Pro 2010” to see the information about your FilmQA™ Pro installation, e.g. version number, license ID, license renewal date, etc.
b. status bar
To view the current status, make changes to the status history and the appearance of the screen, and to copy a screen shot.
The Status Bar is located at the bottom of the screen. It allows you to view the current status, to make changes to the status history, to change the appearance of the screen, and to copy a screen shot.
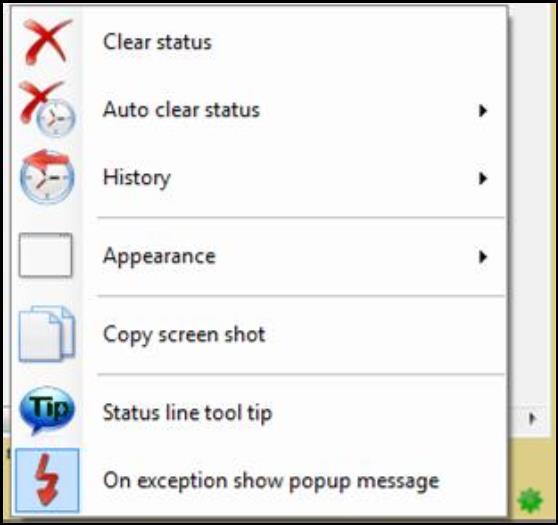
Right click on the “Status Bar” and
- Select “Clear status” to clear the status displayed on the “Status Bar.”
- Select “Auto clear status” to set the elapsed time before the information displayed in the “Status Bar” is erased.
- Select “History” to view the status history
- Select “Exceptions” to show the “Exception history” window. This allows you to view the history of software exceptions which are events where the application cannot complete a user-requested task. They are a tool to aid in identifying and fixing software bugs.
- Right click inside the "Exception history" window and
- Select “Exception level depth” to change the level of exception showing in the “Exception history” window. For example, “Exception 1” in the image below has three exception levels.
- Select “History length” to select the number of exception data allowed to view in the “Exception history” window.
- Select “Reset history” to clear all the exception data in the window.
- Select “Word wrap” to wrap the words to fit the window width.
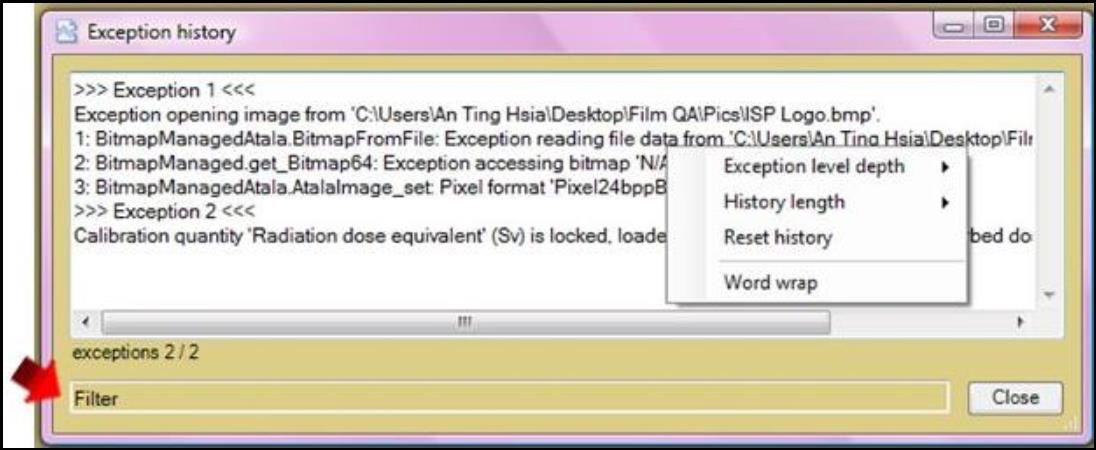
- The “Filter” panel allows you to enter a filter string to reduce the number of visible exceptions in the window. See detailed descriptions and examples in “Menu.”
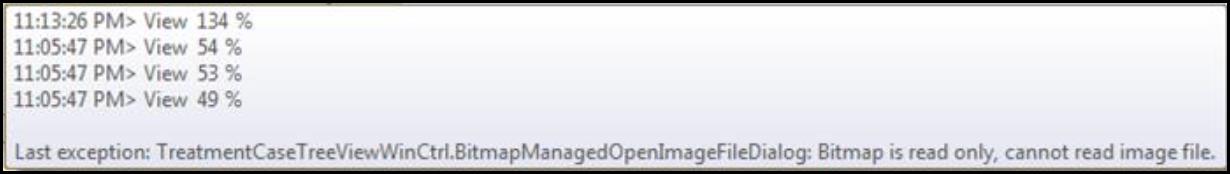
- Select “Status” to view the “Status history” window showing the complete status history since the application was opened.
- Right click in the “Status history” window to clear the status history, copy all the status, or copy the selected row.

- Right click in the “Status history” window to clear the status history, copy all the status, or copy the selected row.
- Select “Appearance” to change the appearance of the screen. See details in “Padding” panel section.
- Select “Copy screen shot” to copy an image of the current screen.
- Select “Status line tool tip” to see an overview of status history when moving the cursor to the “Status Bar.”
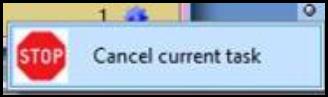
- Check or uncheck “On exception show popup message” to turn on or off the popup windows generated when exceptions occur. The “Task” button locates on the lower right corner of the screen. It appears as

when there is no task calculating and appears as
when calculations are being performed. The number on the left indicates the number of tasks being calculated. Right click on the button and select “Cancel current task” to cancel the task that’s being calculated.
c. padding
To change the configuration of the screen.
Padding allows you to change the configuration of the screen.
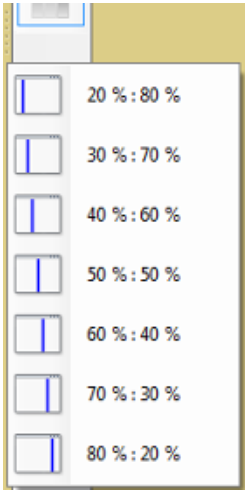
Right click on the  between two panels to adjust the relative size of the adjacent panels.
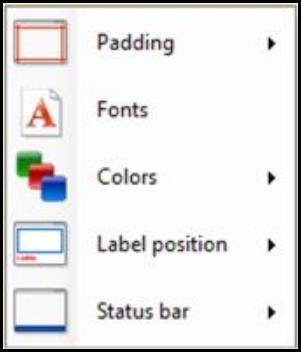
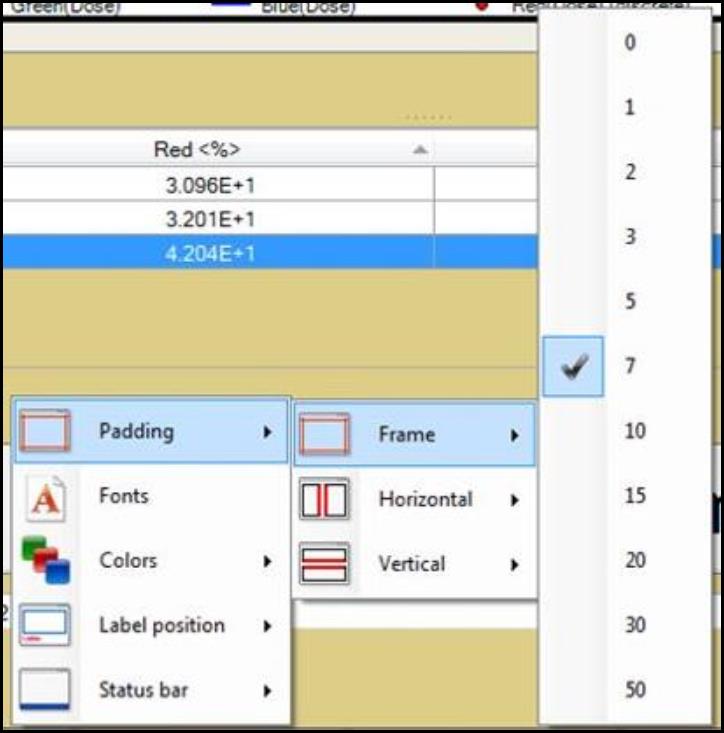
Right click on the “Padding” and
- Select “Padding” to change the amount of padding on the screen.
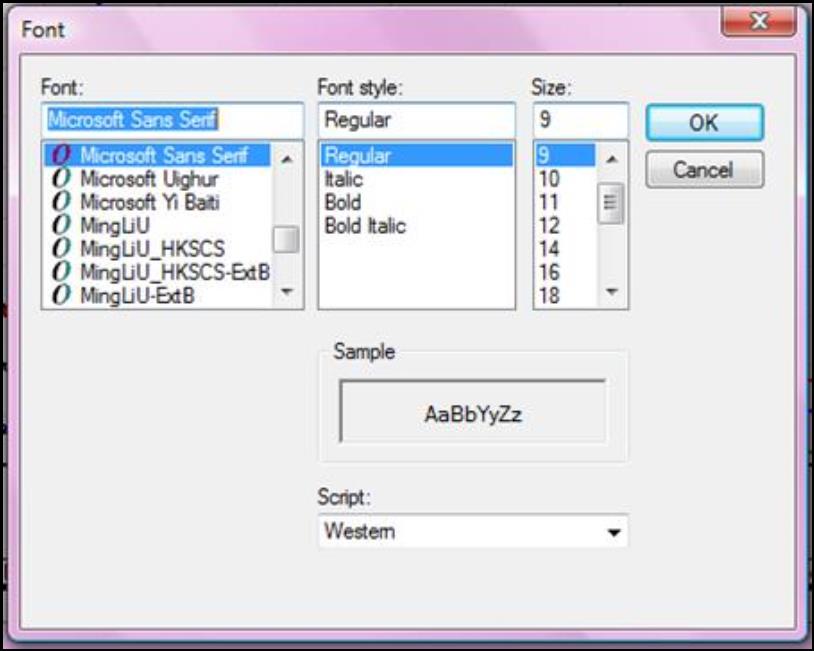
- Select “Fonts” to display the “Fonts” window. This allows you to change the font type and size and in different group of fonts.
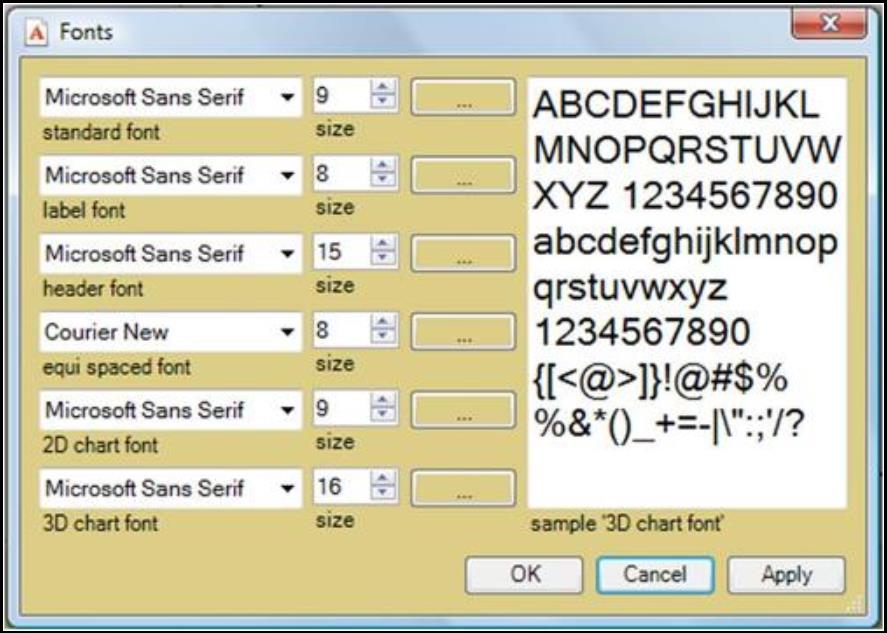
To change the font style or script, click on to have the “Font” window pop up for each individual group of fonts.
- Select “Colors” to change the appearance color.
- Select “Fore color” to change the color of words on the "Padding."
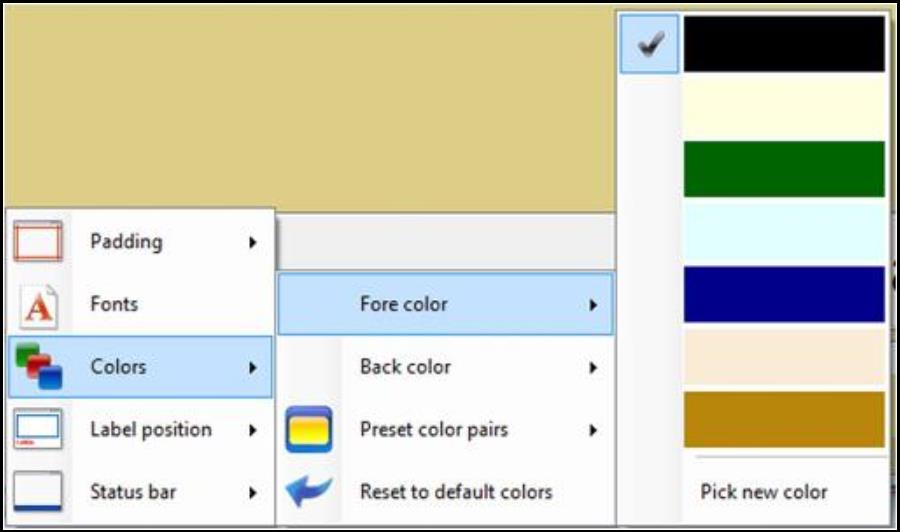
- Select “Back color” to change the color of padding.
- Select “Preset color pairs” to change both the color of padding and words to a preset color pair.
- Select “Reset to default color” to change both the color of padding and words to the default colors. ·
- Select “Fore color” to change the color of words on the "Padding."
- Select “Label position” to change the location of buttons and panel labels.
- Select “Status bar” to show, hide, or change the color of the "Status Bar.
d. case data selector
Shows the case management tree which allows you to add selected image objects into case data.
Case Data Selector allows you to add patient information, calibration data, film images, and data analyses from a saved file, or directly from a scanner. Each object added to the tree is dependent on the objects above it.
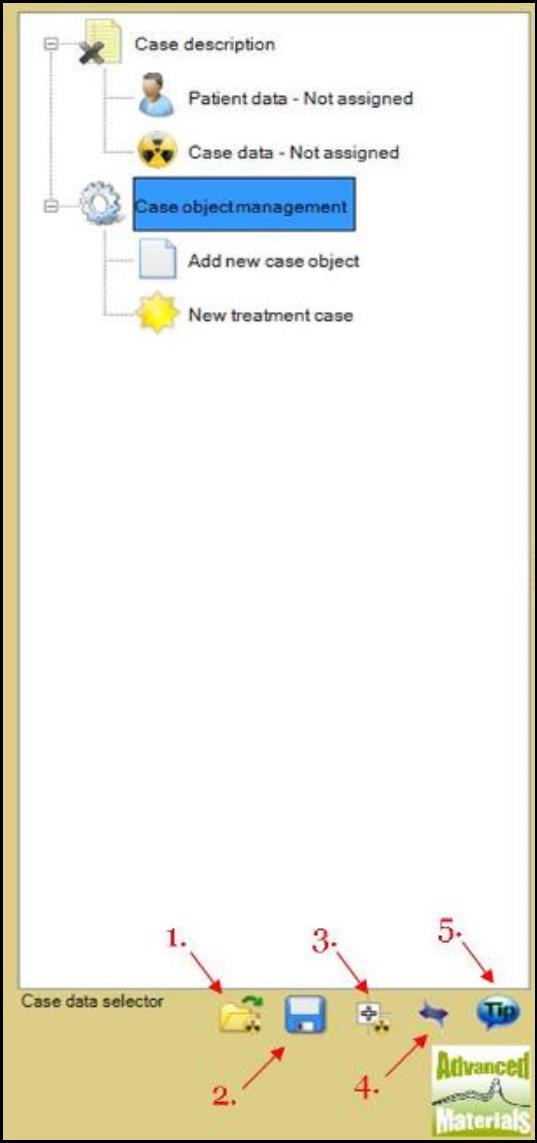
- Select “Open” button to open treatment case from file.
- Select “Save” button to save treatment case to the computer. This saves all the objects opened in the case data selector as one case.
- Select “Expand” button to expand only the selected treatment object tree node.
- Select “Scanning Parameters” then
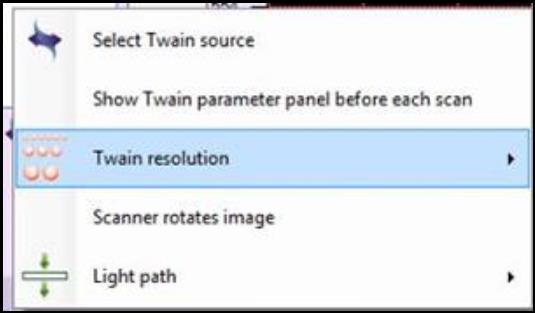
- Choose “Select Twain source” to choose the desired scanner. The “Select Source” window will pop up. Choose the appropriate scanner to scan.
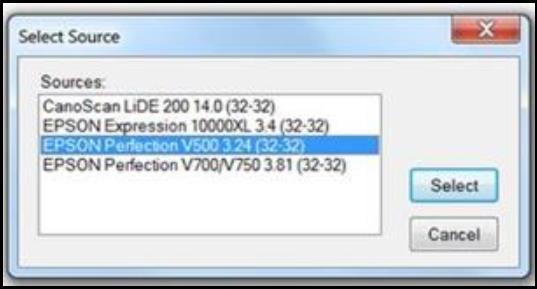
- Check “Show Twain parameter panel before each scan” to have the model specific scanner panel open each time when scanning using FilmQA™ Pro.
- Select “Twain resolution” to change the spatial resolution of the scans.
- Select “Scanner rotates image” to rotate the image 90 degree to match the scanner information. This feature is used for some scanner drivers which would auto rotate the image without rotating the device information, e.g., Epson combined with Windows XP.
- Select “Light path” to choose between the reflective mode and the transmissive mode for the scanner.
- Choose “Select Twain source” to choose the desired scanner. The “Select Source” window will pop up. Choose the appropriate scanner to scan.
- Select “Tool Tip” button to show or hide all the tool tips. “Case description” allows you to identify patient data and his “Case description” allows you to identify patient data and his/her associate case data.
- The “Patient data” drop down list allows you to select the patient preferred to view. Click on the icon and select the appropriate patient name or “ ” to deselect any data selected previously. Select to open the "Patient Data Window"
- The “Case data” drop down list allows you to select the preferred case specific to the patient selected under “Patient data” drop down list. Double click on the icon to open the “Case Data Window” and select the preferred case in “Case list.” The “Patient data” will be changed to match the patient name of the treatment case selected.
“Case object management” allows you to add objects to the case selected in “Case description” and to create calibration data.
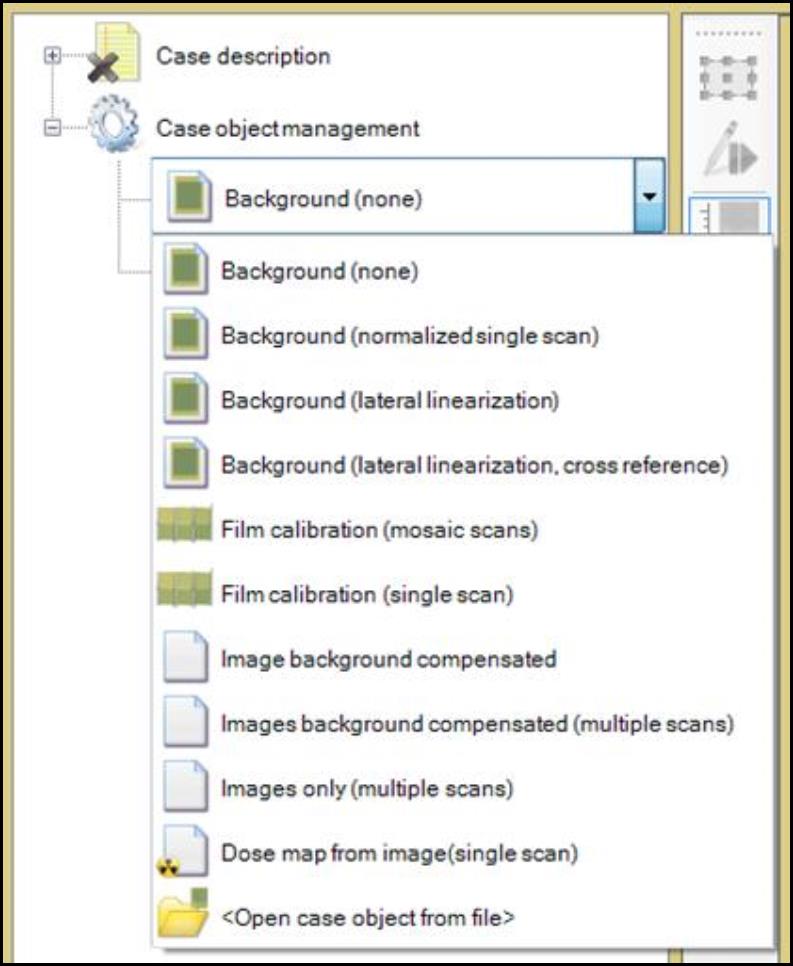
- “Add new case object” drop down list allows you to select different types of new object to add to the treatment case. Below is a brief description of the object selection on the list:
- The “Background (none)” option produces an empty background which creates no compensation of scanner effects to the case.
- The “Background (normalized single scan)” option allows you to scan a blank film to correct for scanner effects.
- The “Background (lateral linearization)” option allows you to scan films to correct for lateral scanner non-linearity.
- The “Background (lateral linearization, cross reference)” option allows you to scan films to correct for the non-uniform thickness or unevenly exposed EBT film stripes in addition to the lateral scanner non-linearity.
NOTE: See detail instructions for each background selection under “Background” section. - The “Film calibration (mosaic scans)” option allows you to scan multiple film patches of known exposure to create calibration function.
- The “Film calibration (single scan)” option allows you to scan one film with multiple regions of known exposure to create calibration function.
Note: See step-by-step instructions of obtaining calibration data under “Calibration” section. - The “Image background compensated” option allows you to apply background selected to an image to correct for different effects based on the background selected.
- The “Images background compensated (multiple scans)” option allows you to apply background select to multiple images to correct for different effects based on the background selected.
- The “Images only (multiple scans)” option allows you to scan images without any specification.
- The “Dose map from image (single scan)” option allows you to create dose map derived from exposed film using background correction and calibration.
- The “<Open case object from file>” option allows you to open case object from file.
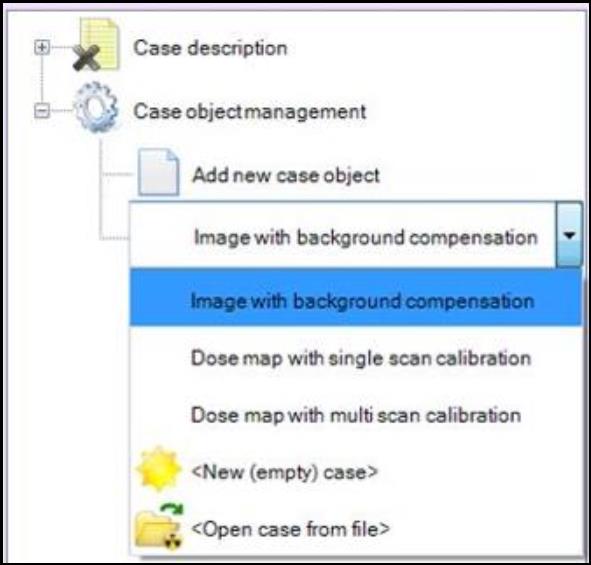
- “New treatment case” drop down list allows you to select a template of objects to create a treatment case. Below is a brief description of the template selection on the list:
- The “Image with background compensation” template creates both the “Background (normalized single scan)” and the “Image with background compensation” to the panel.
- The “Dose map with single scan calibration” template creates the “Background (normalized single scan),” the “Film calibration (single scan),” and the “Dose map from image (single scan)” to the panel.
- The “Dose map with multi scan calibration” template creates the “Background (normalized single scan),” the “Film calibration (mosaic scans),” and the “Dose map from image (single scan)” to the panel.
- The “<New (empty) case>” option erases everything opened under “Case Data Selector.” * The “<Open case from file>” option allows you to open case from file.
e. image panel
Displays the image and region of interest for dose calibration and measurement.
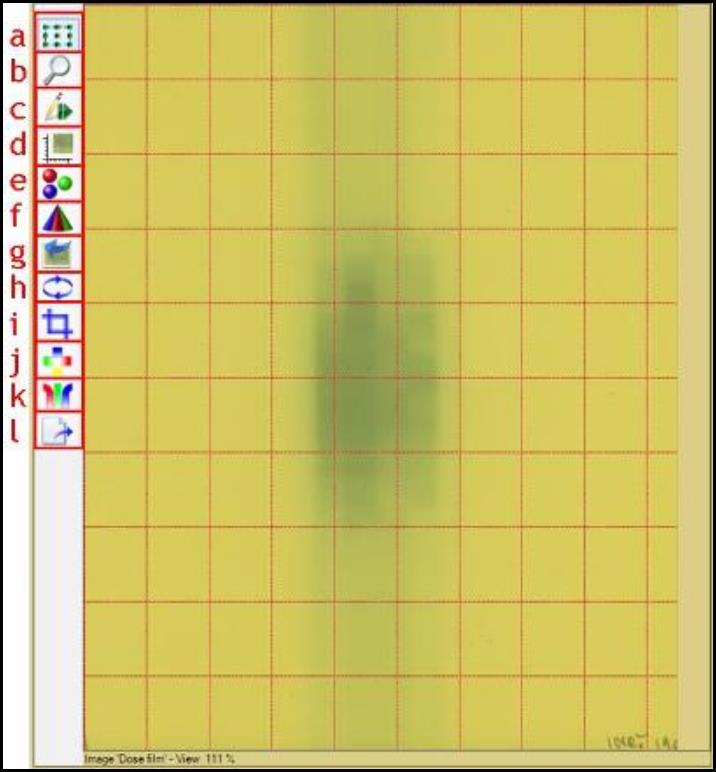
The Image Panel is located at the center of the screen. It allows you to view the active image and to select the region of interest for dose calibration and calculation.
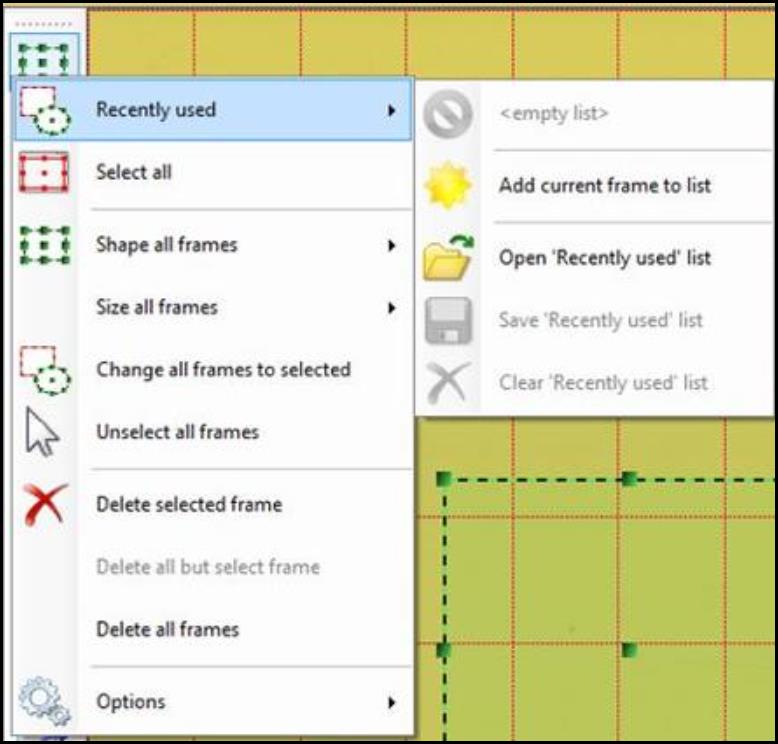
- "Selection frame tool" allows you to select the region of interest on the image displayed. Click and drag on the image to select a region of the image. Right click on the button and select
- Recently used” to create, open, save, or clear lists of frame used previously.
- "Options" to change the frame color, the selected frame color, the frame width, the marker width, and the selector opacity.
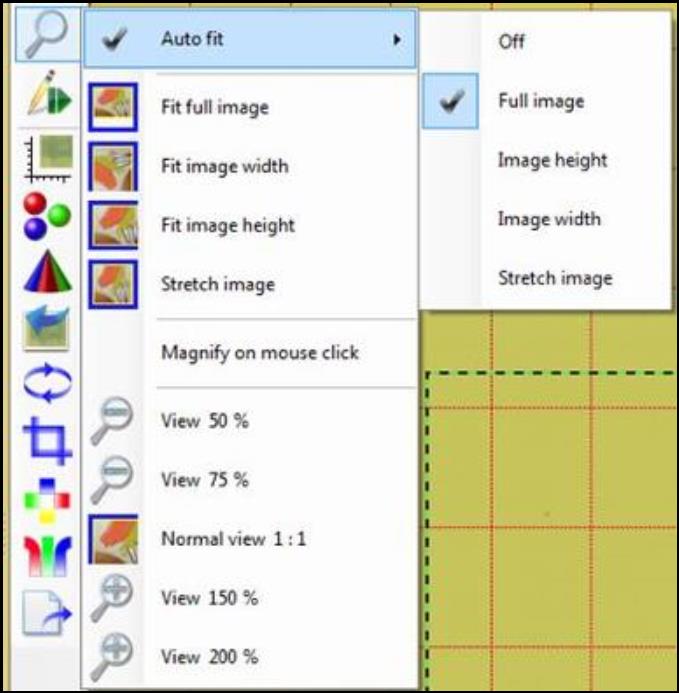
- “Magnifier tool” allows you to zoom in and out of the image. Click on the icon and scroll up to zoom in and down to zoom out using the mouse. Click on the icon and select:
- “Auto fit” to fit the image automatically to your preference everytime when an image is displayed in the “Image Panel.”
- “Magnify on mouse click” and click on the image to enlarge the image by 50%. Shift + click to reduce the image by 33%.
- “Pause tool” allows you to stop all the image tools selected.
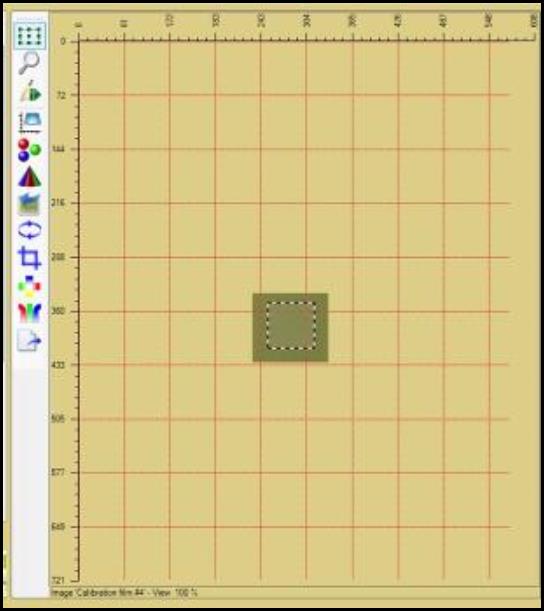
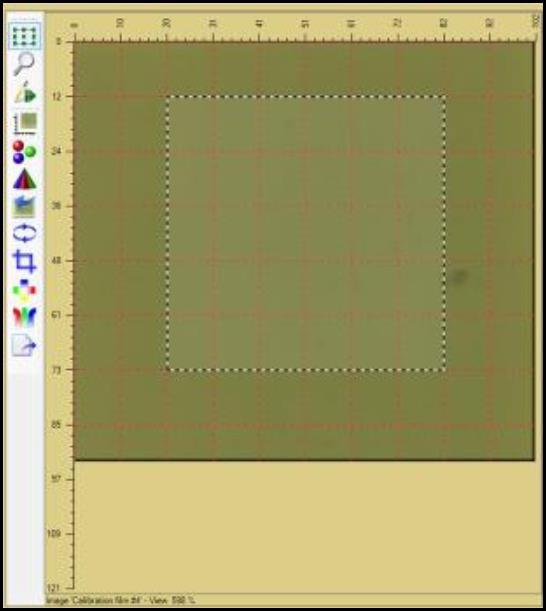
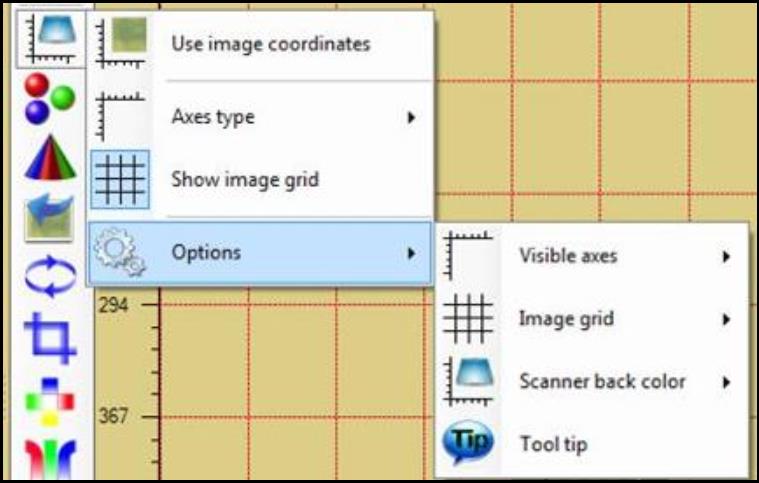
- The “Image scaling” button allows you to select image coordinate system and axis units. Click on the button and
- Select “Use scanner coordinates” or “Use image coordinates” to change the editor coordinate system between image and scanner. This allows to compare scanner effects on images easier. As shown in the images below, the left image has the scanner coordinates turned on while the right image has the image coordinates turned on.
- Select “Options” to change the configuration of axes, image grid, and color of scanner background when scanner coordinates are used.
- Select “Use scanner coordinates” or “Use image coordinates” to change the editor coordinate system between image and scanner. This allows to compare scanner effects on images easier. As shown in the images below, the left image has the scanner coordinates turned on while the right image has the image coordinates turned on.
- “Color channel selector” allows you to select, invert, or gray the color channels of the image viewed in the “Image Panel.” Please note that the tool does NOT change the image bitmap itself. It only changes the screen view.
- “Color range spreader” allows you to select range of the color channels of the image viewed in the “Image Panel.” The tool changes only the screen view. It doesn’t change the image bitmap. The button appears as
 when full color range is off. Click on the button to scale color channels to selected frame range. Right click on the button and select:
- “Delete color channel scaling” to change the channel scaling back to full range.
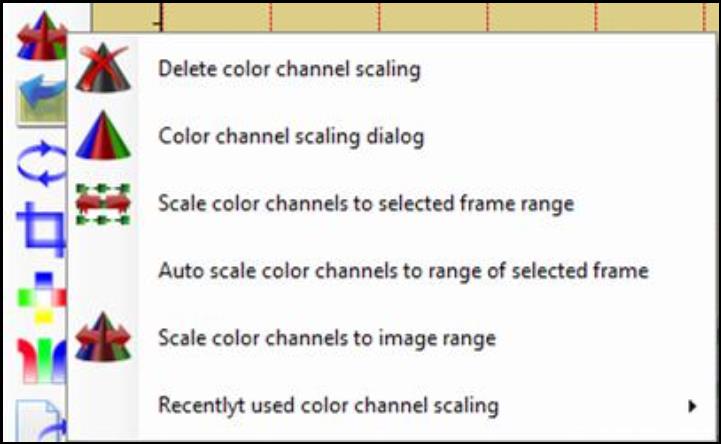
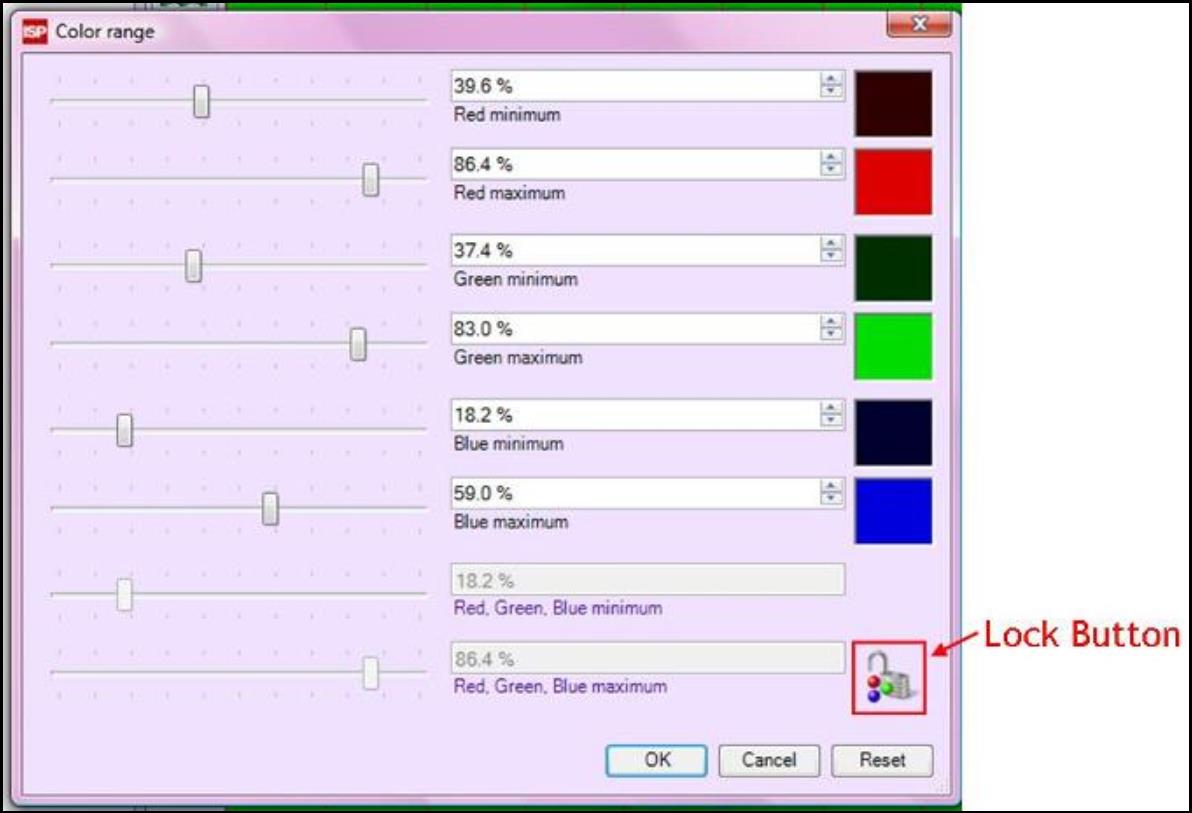
- “Color channel scaling dialog” to open the “Color range” window. The window allows you to manually enter the minimum and maximum color range. Click on the “Lock Button” to make the minimum and maximum values of all three color channels the same.
- When “Auto scale color channels to range of selected frame” is on, it sets the image color channel ranges to the ones of the selected frame in real time. Move the selected frame around to see the change of color ranges.
- “Scale color channels to image range” sets the color ranges to the ones of the image displayed.
- “Delete color channel scaling” to change the channel scaling back to full range.
- “Undo, redo buffer” allows you to undo and redo the changes made to the image. To change the maximum number of undo steps, right click on the icon, select “Options” and then select “Maximum number of Undo steps.”
- “Flip and rotation tool” allows you to flip or rotate the entire image or the region of current image selection. To flip or rotate the region of selection, right click on the icon, select “Options” and check “Rotate and flip applicable to selections.
Please note that the scanner information will be revoked when applying a 90° rotation. - “Crop tool” allows you to crop image to the region of current image selection. To change the color of filling outside the cropped image, right click on the icon, select ”Options” and “Crop fill color.”
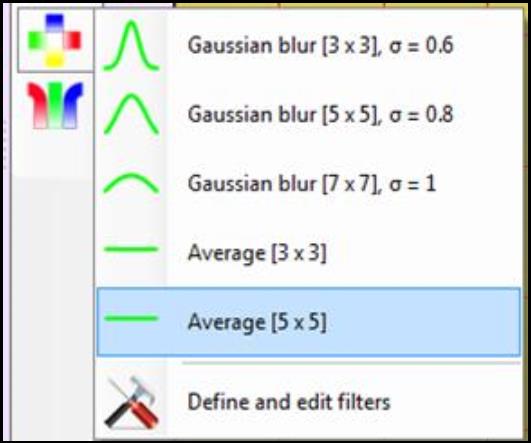
- “Filtering tool” filters entire image or region of current image selection by allowing pixel modifications using a filter matrix to combine surrounding pixels. Click on the icon to apply filters. Select “Define and edit filters” to open the “Bitmap Filter Editor.” To apply filters to region of selection only, right click on the icon, select “Options” and check “Filter applicable to selections.”
- “Color translation tool” allows you to translate colors of entire image or region of current image selection. This tool changes the bitmap of the image. Click on the icon and
- Select “Equalize color channel” to divide all color values by normalized value of equalizing color channel. For example, when “Equalize Red” is selected, all color values are divided by normalized red value. All red values will be identical with the average red value. The new R, G, B transformed color channel, Xnew, is calculated by
Xnew = Xold*Yave/Y
where Xold = old R, G, B transformed color channel
Y = red
Yave = red average value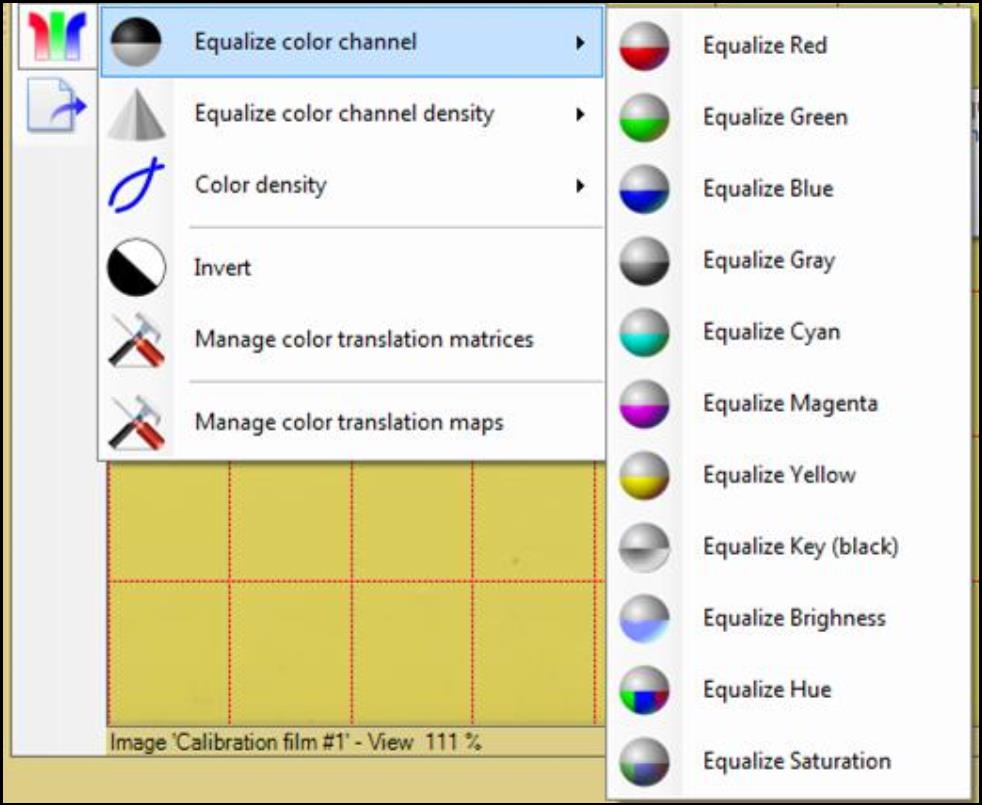
- Select “Equalize color channel density” to divide all color channel densities by normalized density of equalizing color channel. For example, when “Equalize Red density” is selected, all color channel densities are divided by normalized red density. All red densities will be identical with the average red density. The new R, G, B transformed color channel, Xnew, is calculated by
Xnew = Xmax^log(Xold)*ave(log(Y))/log(Y)
where Xmax = maximum color valuelog = logarithm to base Xmax
Xold = old R, G, B transformed color channel
Y = red
ave(log(Y)) = average value of log Red value. - Select “Color density” and then
- “Translate to color density” to translate color to its logarithmic value. The new R, G, B transformed color channel, Xnew, is calculated by
Xnew = Xmaxlog(Xold) - “Translate from color density” to translate color to its exponential value from color density. The new R, G, B transformed color channel, Xnew, is calculated by
Xnew = Xmax^(Xold/Xmax)
- “Translate to color density” to translate color to its logarithmic value. The new R, G, B transformed color channel, Xnew, is calculated by
- Select “Invert” to invert color channel values for creating image negative effect.
- Select “Manage color translation matrices” to open the “Bitmap Color Translation Editor.”
- Select “Manage color translation maps” to open the “Color Translation Maps Editor.”
- Select “Equalize color channel” to divide all color values by normalized value of equalizing color channel. For example, when “Equalize Red” is selected, all color values are divided by normalized red value. All red values will be identical with the average red value. The new R, G, B transformed color channel, Xnew, is calculated by
- “Image exporter” allows you to export to file or clipboard the entire image, the image with color channel selected, or region of current image selection.
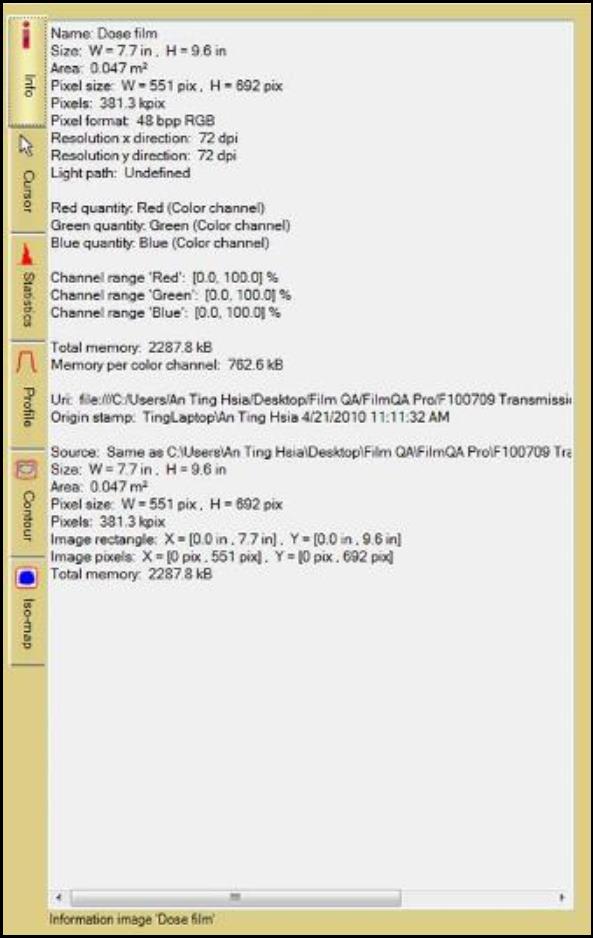
f. film evaluation panel
Evaluates images converted to dose space using a multitude of quantitative analysis tools.
The Film Evaluation Panel locates on the right side of the application. This section displays information on images opened in the “Image Panel.” It allows you to evaluate images converted to dose space using a multitude of quantitative analysis tools. The panel contains six sub-panels: “Info Panel,” “Cursor Panel,” “Statistics Panel,” “Profile Panel,” “Contour Panel,” and “Iso-map Panel.” Click on the tab located on the left side of the “Film Evaluation Panel” to access each sub-panel.
-
padding
Allows you to review the image and source information.
-
cursor panel
Displays the magnified view of the region around the cursor in the “Image Panel” as well as its information.
-
statistics panel
Shows the dose histogram and the image pixel statistics.
-
profile panel
Shows the image pixel statistics profile along the path drawn in the “Image Panel”.
-
contour panel
Displays the iso-line chart of the image in the “Image Panel” for a given set of contour level values.
-
iso-map panel
Displays the iso-dose map of the image in the “Image Panel” for a given set of contour level values.
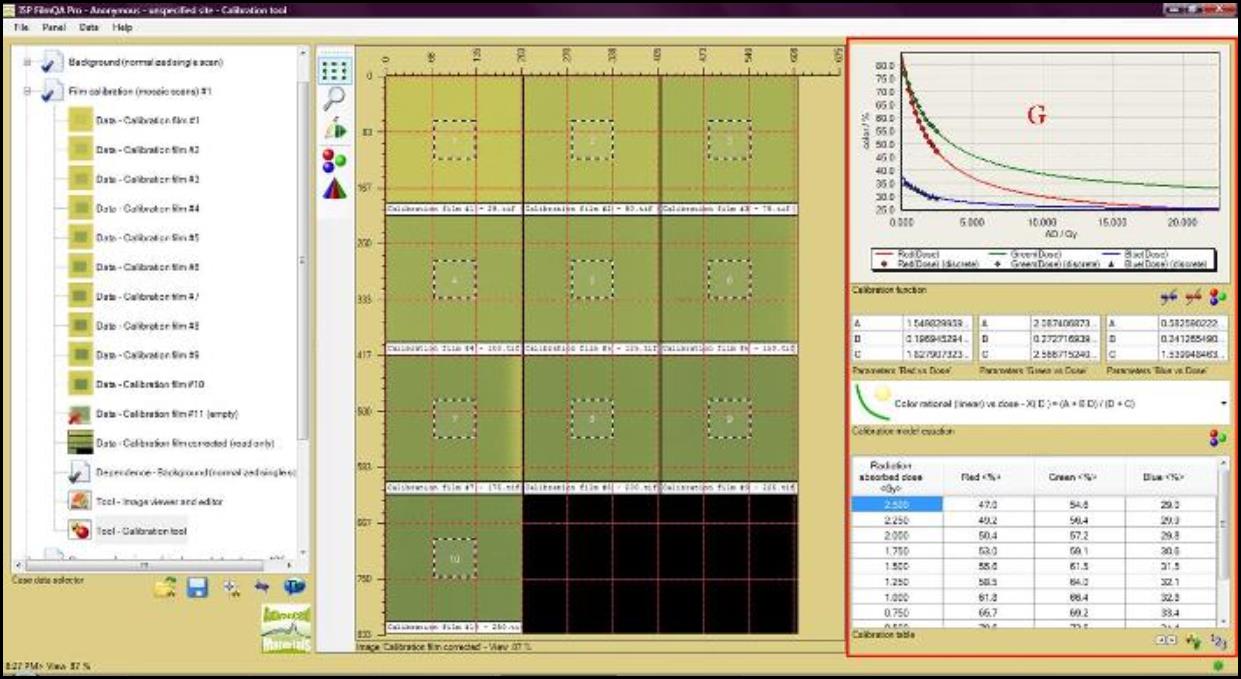
g. calibration tool panel
Displays the calibration data, fitting function and coefficients..
The Calibration Tool Panel displays the calibration data, fitting function and coefficients. The panel can be accessed under “Panel” in “Menu” or “Film calibration” in “Case Data Selector.” It allows you to create calibration file based on the user-defined section of the calibration images.
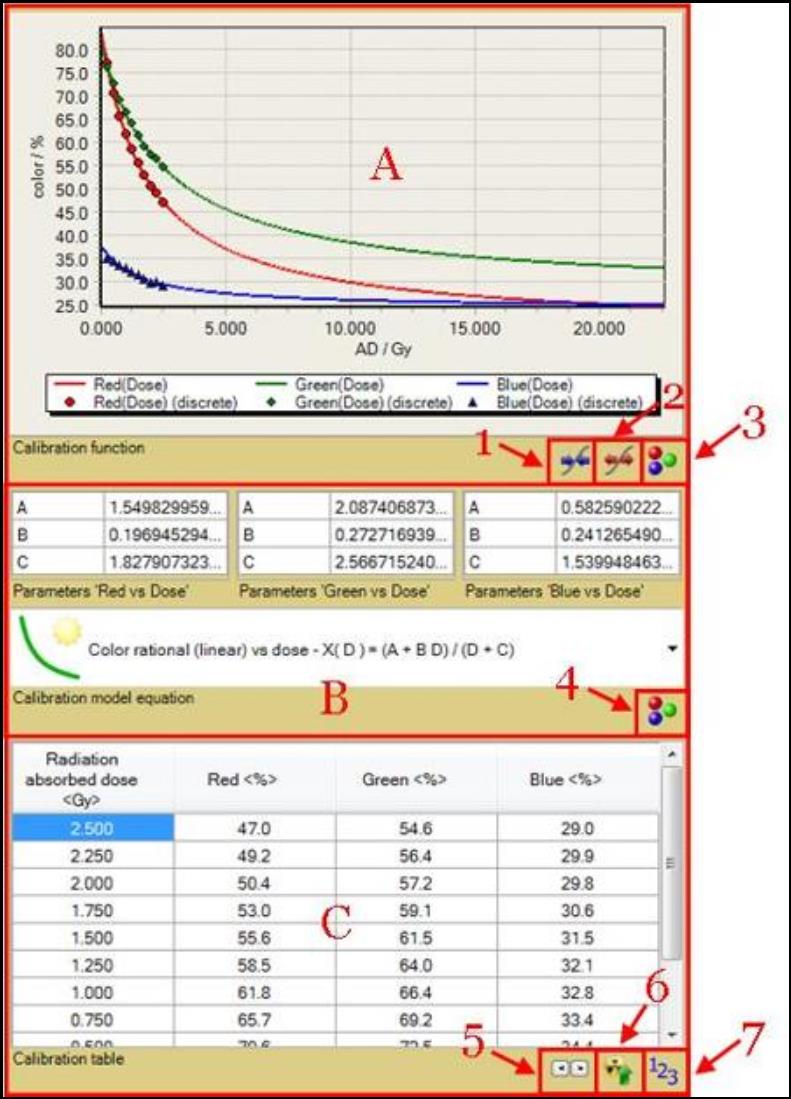
A. The “Calibration Function” chart displays a calibration plot of “color value vs. absorbed dose” for each color channel. There must be enough data points in the “Calibration Table,” C, to fit to a selected calibration function and display the plot.
- To zoom in, left click and drag from top left to bottom right to outline the selected region. To unzoom, right click and drag from bottom right to top left.
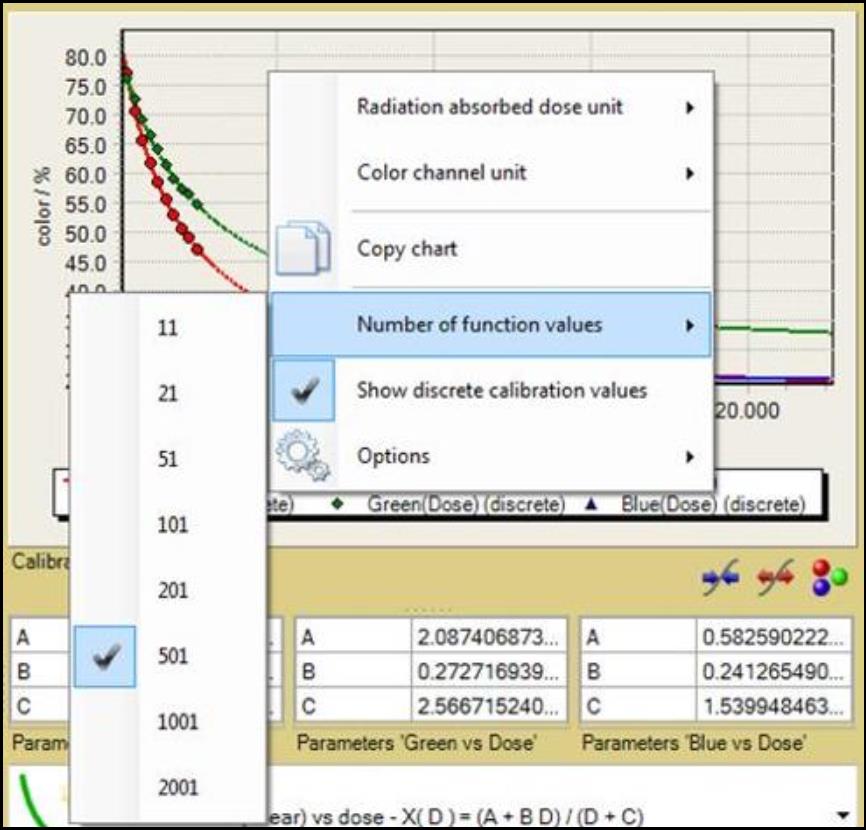
- Right click inside the chart to change the unit of x- and y-axis or copy the chart.
- Select “Number of function values” to change the number of points interpolated by the fitting function selected.
- Check or uncheck “Show discrete calibration values” to show or hide the data points from the “Calibration Table,” C
- Select “Options” to change the configuration of the chart.
1 The “Data Range Minimization” button allows you to reduce the range of the axes in the calibration chart to the discrete range of the calibration data, i.e. minimum validity range of the calibration.
2 The “Data Range Maximization” button allows you to extend the range of the axes in the calibration chart to the full color interval and corresponding dose range, i.e. the maximum utilization range of the calibration.
3The “Calibration Color Channel” icon allows you to change the color channels displayed in the calibration chart. The selection does not affect the calibration. It only changes how calibration functions are displayed.
B.The “Calibration Model Equation” drop-down list allows you to choose the equation used to correlate the calibration data.
- All model equations are invertible over the fitting range, i.e. both functions “Color channel vs. Dose” and “Dose vs. Color channel” are available.
- All model equations are differentiable, i.e., changes in dose are continuous and smooth.
- The color channels red, green, and blue are fitted separately.
- X is the color channel value between 0 and 1.
- D is the absorbed dose.
- A, B, and C are the parameters used to correlate dose and color channel value.
4.The “Equation Parameters” icon allows you to select whether calibration function parameters of the color channels are shown. The icon appears as  when parameters are hidden.
C. The “Calibration Table” allows you to view and enter the data points associated with the calibration patches.
The first column indicates the exposure dose of the imported film. During the calibration process, the dose values for the exposed calibration patches are entered in this column to generate a “Calibration Function” chart, A See details in “Calibration.”
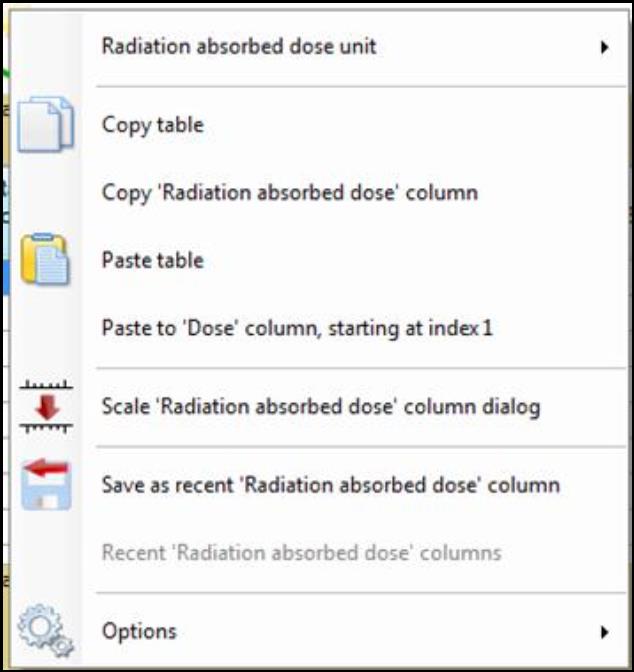
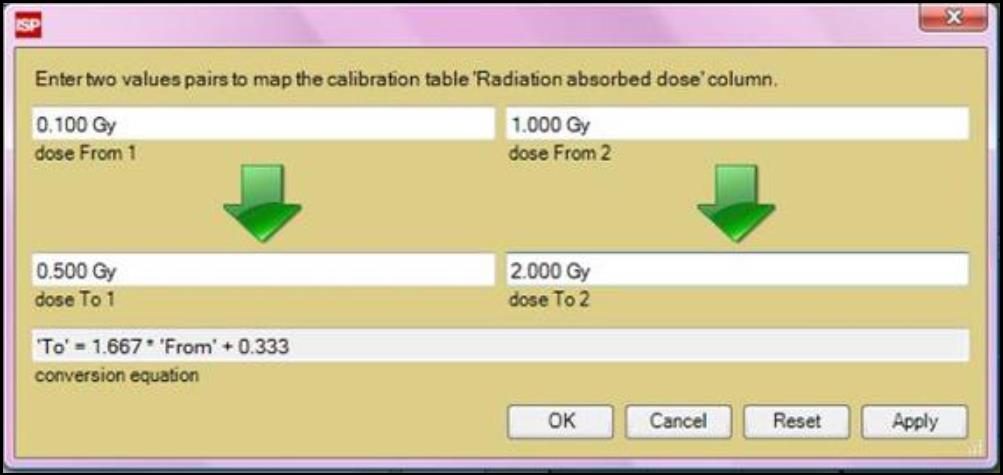
- Right click inside the column and select “Scale ‘Radiation absorbed dose’ column dialog” to enter two value pairs to generate a conversion equation to scale the calibration dose column.
- The other columns contain the average color-values for the regions of interest of the calibration patches for different color channels. Right click inside the columns to copy, paste the table or column, insert or delete rows, change the unit, or change the configuration of the table.
5. The “Number Format Buttons” feature allows you to change the format of the number displayed in the table.
6. The “Synchronize” button allows you to synchronize color channel values with radiation absorbed dose values. It reassigns calibration table so that the radiation absorbed dose values and selected channel values are sorted ascendingly. Click on the button to select the color channel preferred to synchronize. Synchronization works only when “Auto Copy,” 7, is on
7. The “Auto Copy” button allows you to copy color channel values from the image selection in “Image Panel.” The color values across each selection frame is averaged and copied to the calibration table. The icon appears as  when the auto copy feature is on.
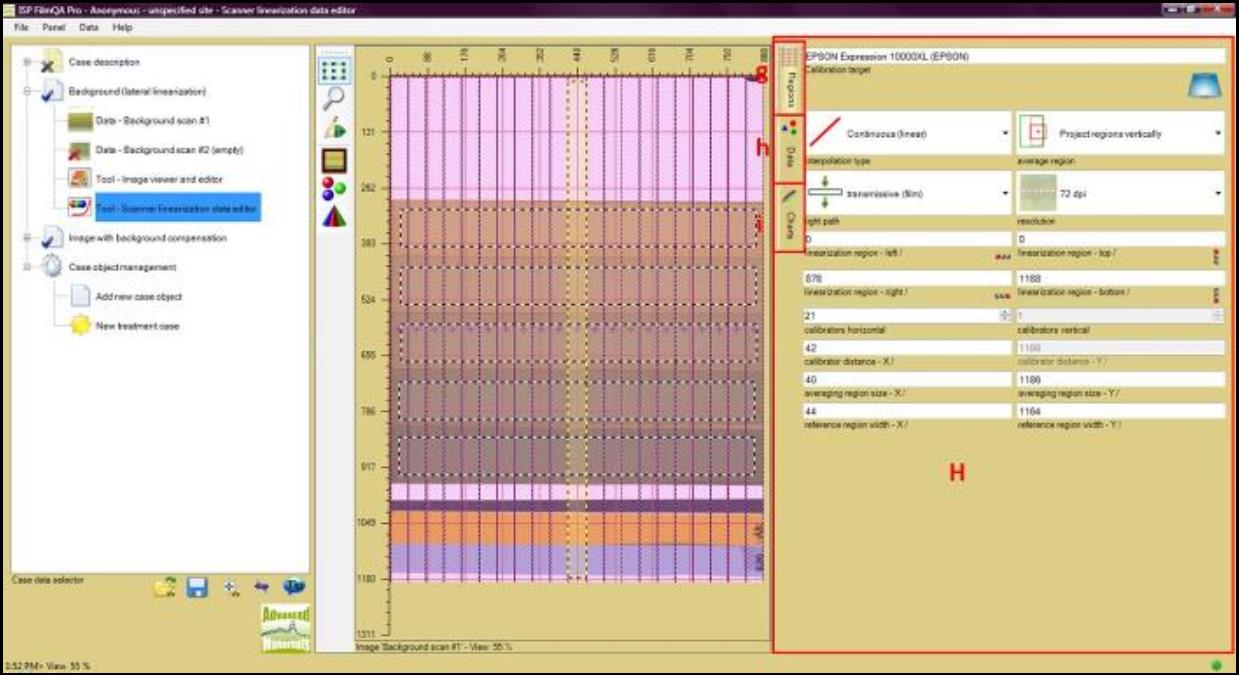
h. scanner linearization panel
Displays tools for scanner linearization correction.
The Scanner Linearization Panel locates on the right side of the application. It is opened when “Tool – Scanner linearization data editor” in “Background (lateral linearization)” under “Case Data Selector” is selected.
The scanned color value Xscan (x,y) at scanner coordinates (x, y) can be represented as:
- Xscan(x, y) = Xref(y) S(x, y, Xscan(x,y))
- Where X = R, G, B
- Xref(y) = value at scanner reference area
- S(x, y, Xscan(x,y)) = scanner characterizing function
The scanner characterizing function S depends on scanner location and color value X. An ideal scanner would have the function equal to one. The task of the scanner linearization correction is to approximate the scanner characteristic function S. When a background film image is used to calibrate the lateral linearization of the scanner, the scanner is segmented into even grid of color calibrators to mitigate location dependence of scanning results. Each calibrator averages the RGB color channel data over a surrounding region and correlates those data with the scanner center region. The “Scanner Linearization Panel” allows you to view and define calibrator grid regions, calibration function, and calibration chart for the scanner linearization calibration. The panel contains three sub-panels: “Regions Panel,” “Data Panel,” and “Charts Panel.”
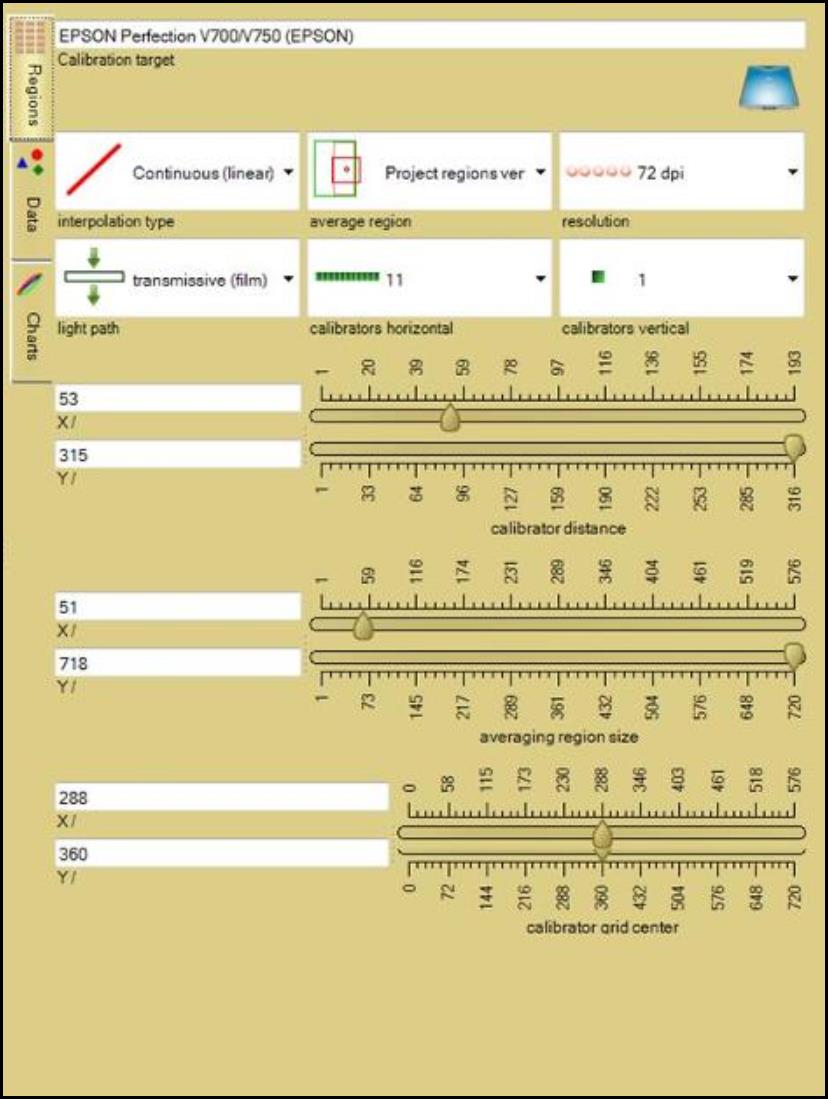
a. regions panel
Allows you to define the regions used to approximate the scanner characteristic function S.
b. data panel
Allows you to view the scanned color value calibration function and the graph associated with it.
c. charts panel
Shows the chart calibrator functions with respect to scanned color or profile along selected path of the background image.
image comparer panel
delta map panel · projection panel · rotation knob · direction pad · report panel
1. delta map panel
Displays Gamma, DTA, Dose difference map, passing rate and parameters.
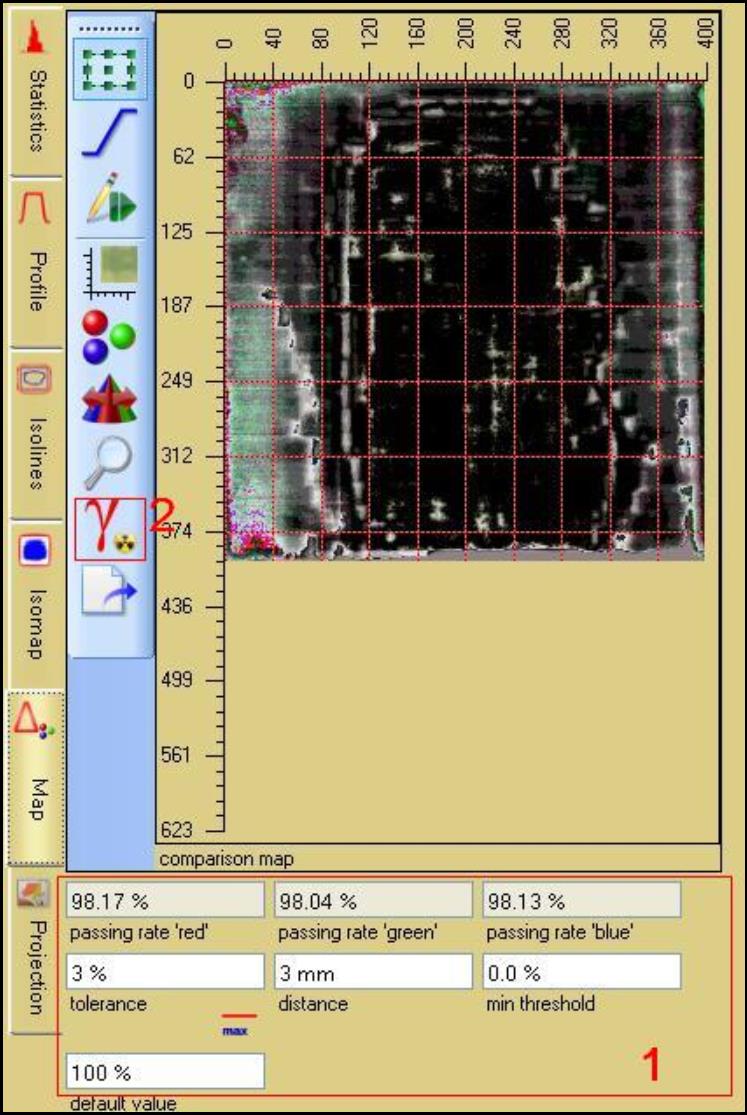
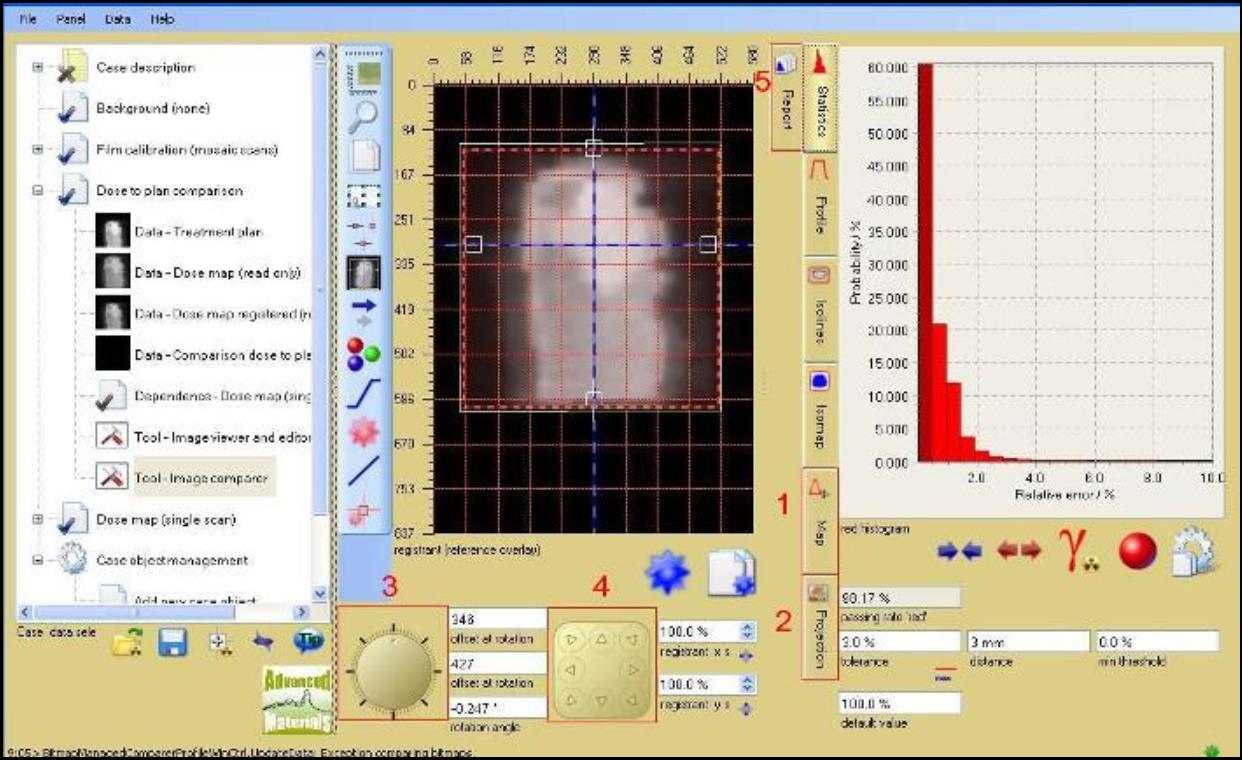
Figure 1
The Delta Map Panel is one of the sub-panels of “Image Comparer Panel”. Click on the fifth tab to access the “Delta Map Panel”. It displays Gamma, DTA, Dose difference map, passing rate and allows you to input the related parameters.
1. Passing rate and related parameters As shown in figure 1, this area display the passing rate and allow you to input the related parameter. In figure 1, it use Gamma method, the passing rates for three channels are 98.17% (red), 98.04% (green), 98.13% (blue). The tolerance parameter is 3% and the distance parameter is 3mm. You can input your own parameters. (e.g. 5% for tolerance, 5mm for distance)
2. Comparison map select FilmQA Pro supports 3 regular comparison methods: Differential Delta map (Dose difference), Distance to agreement map (DTA) and Composite Gamma map (Gamma). You can change the method by click the “Comparison map select” button, as shown in figure 2, e.g. change to Differential Delta map.
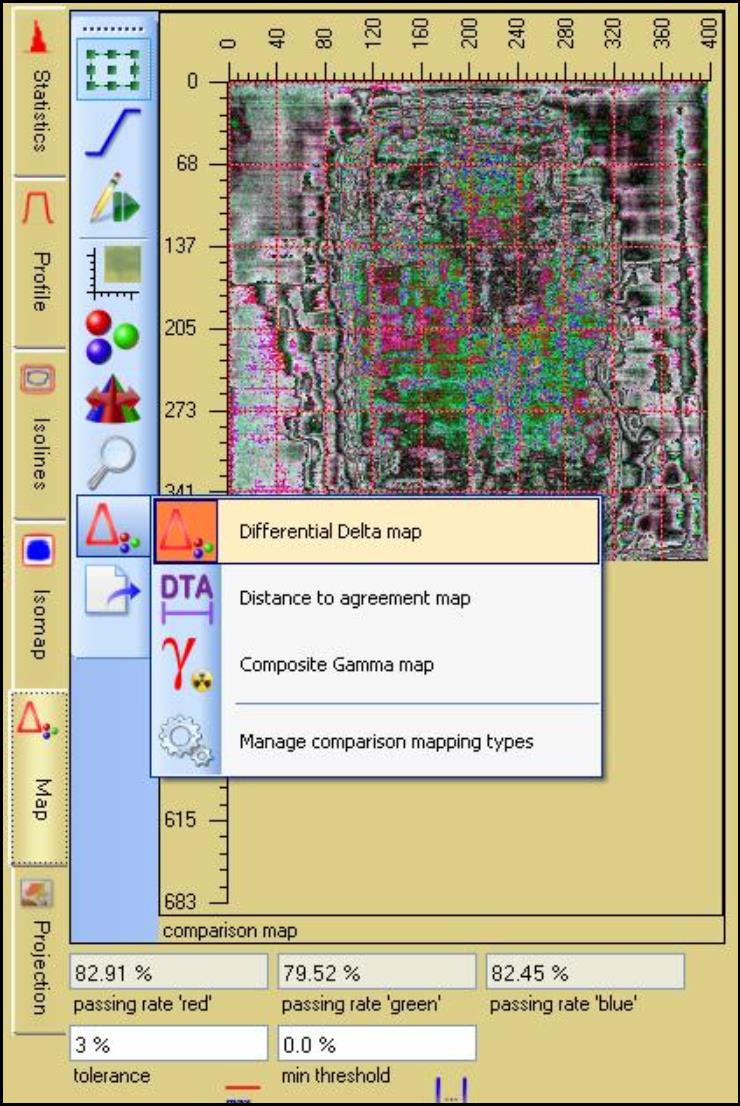
Figure 2
2. projection panel
Display the dose map projected at plan coordinates (same resolution like plan).
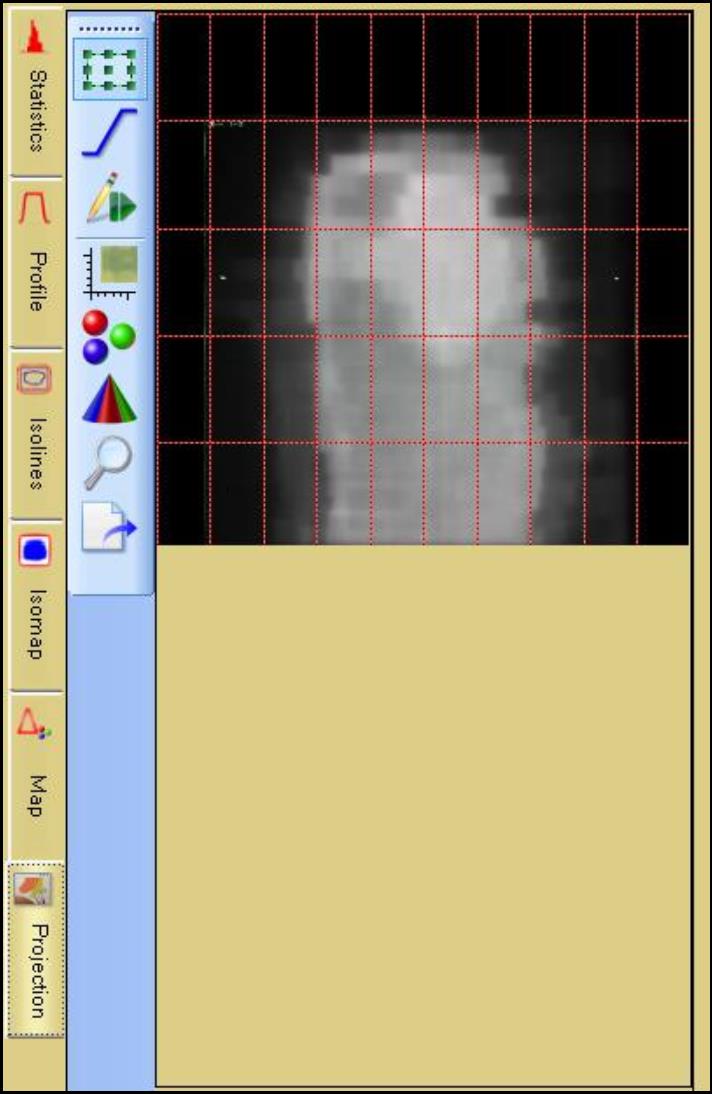
Figure 2
The Projection Panel is one of the sub-panels of “Image Comparer Panel”. Click on the sixth tab to access the “Projection Panel”. It displays the dose map projected at plan coordinates (same resolution like plan) using the adjusted coordinate transformation (shift, rotation, stretch).
As shown in figure 1, its buttons are nearly the same in “Image Panel” ,you can find the details of the functions there.
3. rotation knob
Adjusts the orientation of the Dose map from the film.
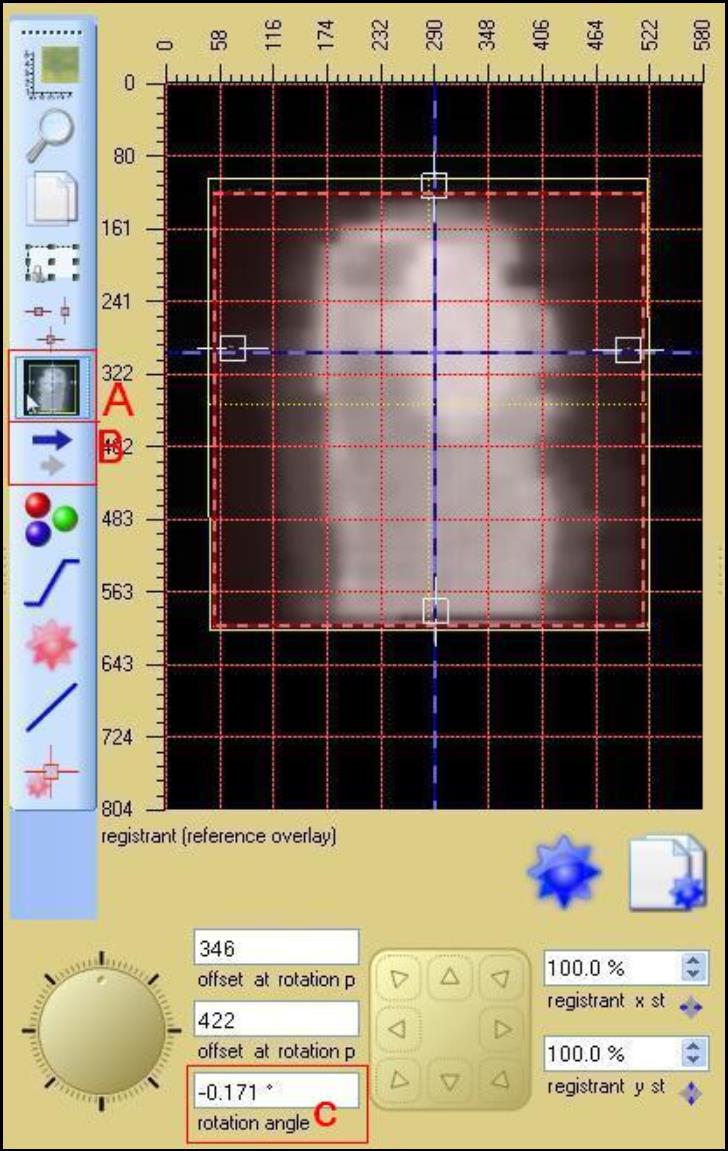
Figure 1
The Rotation knob is one of the tools to adjust the Dose map position. Click the knob to rotate the image to any direction. Use button B to control the image rotation speed. Left click button B to change the cursor speed to decelerated speed, right lick button to select deceleration speed relative to cursor speed.
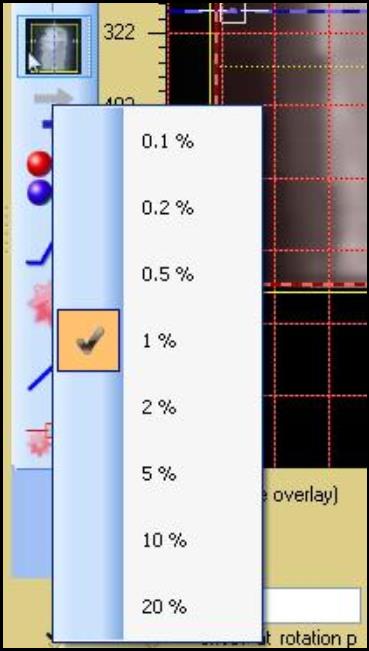
Figure 1
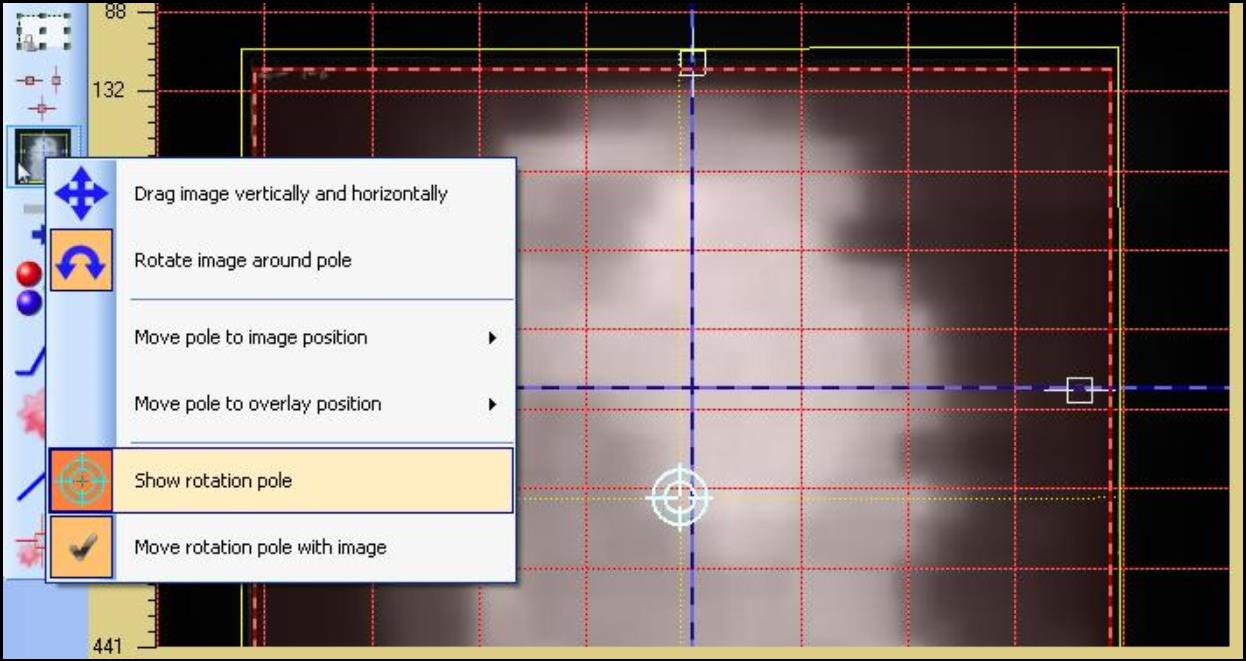
As shown in figure1, use button A  to set the position of the pole. (Rotation center) Right click button A, select “Show rotation pole” to show the position of the pole, then click the pole to move to any position you like, or use the selection “Move pole to image position” and “Move pole to overlay position” to move the pole to a defined position.
As shown in figure 1, C shows the rotation angle. You can also manually input any angle value to get the best passing rate.
4. direction pad
Adjusts the position of the Dose map from the film.

Figure 1
The Direction Pad is one of the tools to adjust the Dose map position.
Click the direction pad to move the image to eight directions.
Use button B to control the image movement speed. Left click button B  to change the cursor speed to decelerated speed, right lick button to select deceleration speed relative to cursor speed.
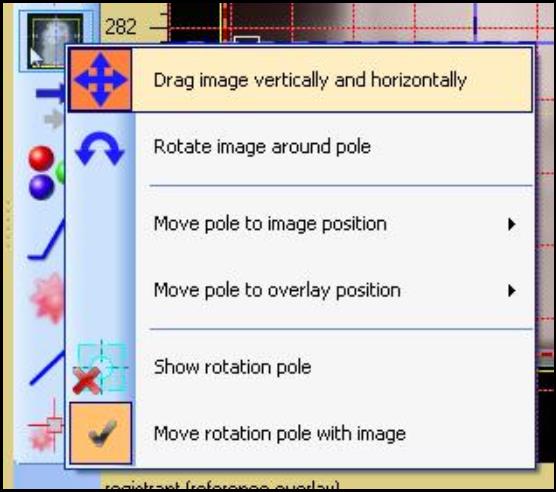
Use button A to enable mouse to drag the image position. Left click the button A, select “Drag image vertically and horizontally”, then you can use your mouse to drag the image.
As shown in figure 1, C shows the offset at the rotation pole. You can also manually input any offset value to get the best passing rate.
5. report panel
Assign the report format, customize the details of the evaluation result.
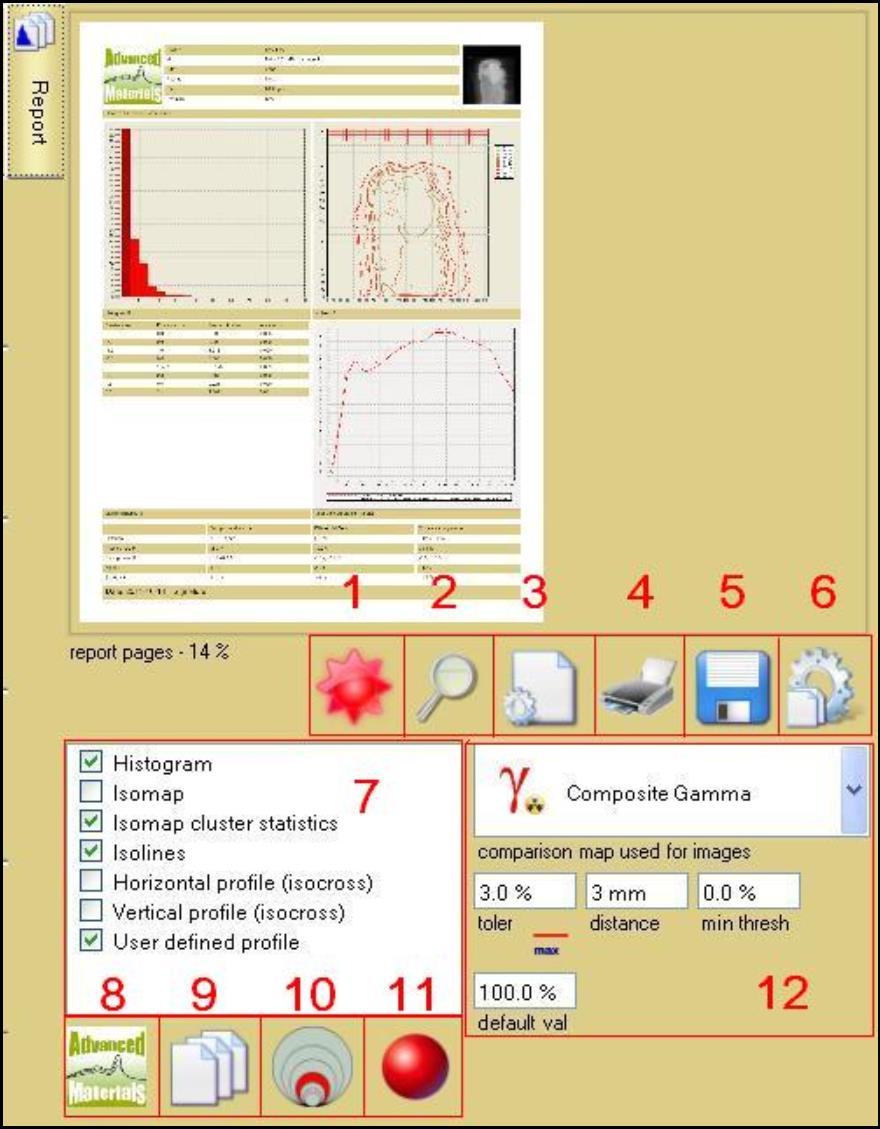
The “Report Panel” is one of the sub-panels of “Film Evaluation Panel” and “Image comparer panel”, use it to assign the report format, customize the details of the evaluation result in the report.
- Update report: Click this button can update the image showing in the report window.
- Magnifier: Click this button can scale the views of the report pages.
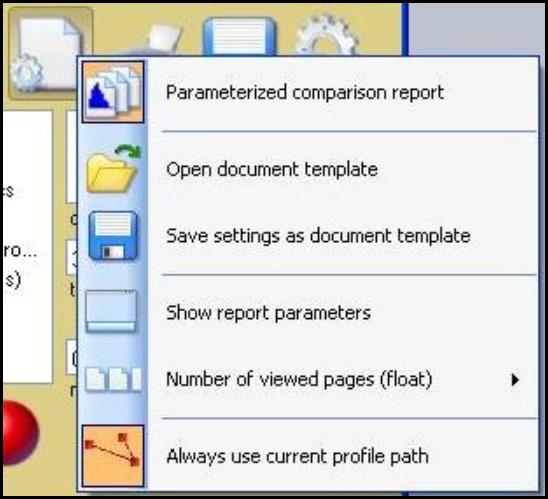
- Report options: Click this button to select different report options.
- Print report: Click this button to open the printer panel.
- Save report as file: Click this button to save the report as PDF file.
- Copy setting: Click this button to copy current setting from all image generating controls including: Isolines, Isomaps, Profile and Histogram.
- Comparison charts: Select the chart types included in the documentation, these will be shown in the report.
- Left top logo: Click this button to load logo image from file.
- Force single page output: Click to switch to single page only, select the maximum number of image rows and columns.
- Image origination size: Click this button to select the image size from 100% to 600%
- Color channels: Click this button to choose comparison maps for the selected color to be added to the report.
- Histogram: Choose from “Gamma”, “Dose difference” and “DTA” to select the related histogram added to the report.
read more >