


filmQA pro™ gamma map analysis
The Gamma map comparison as introduced in the paper by Low D., Harms W., Mutic S., Purdy J. (Med. Phys. 25 (1998) 5, 656-661) is widely used to judge the agreement between treatment plan and dose measurement.
The gamma map function γnorm can be defined as follows:
Normalized differential dose
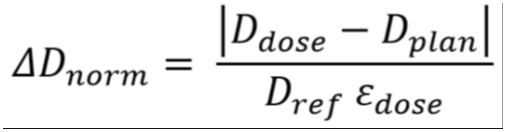
Where as reference dose Dref either maximum plan dose or the local plan dose Dplan is used.
Normalized distance to agreement
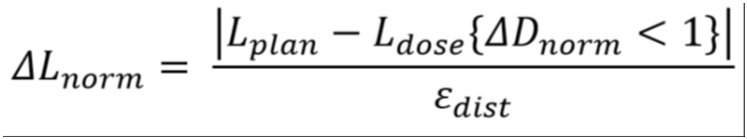
where Limage is a location in the specified image. The determination of ΔL requires the search for a dose map location Ldose where the differential dose is sufficiently small.
Normalized gamma map function
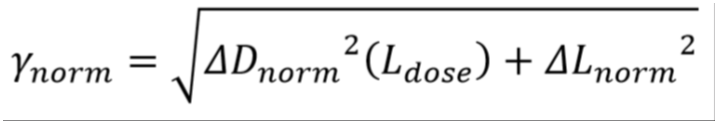
Can be calculated for any given pair (εdose , εdist ) also known as ‘gamma criterion’. The tolerance εdose is given in % and the distance εdist in mm.
A plan location passes the test when
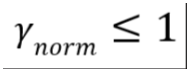
the dose map to plan comparison can be expressed by single number, the gamma passing rate Rγ . The chart below shows the passing rate as a function of tolerance for constant distance εdist = 2 mm.
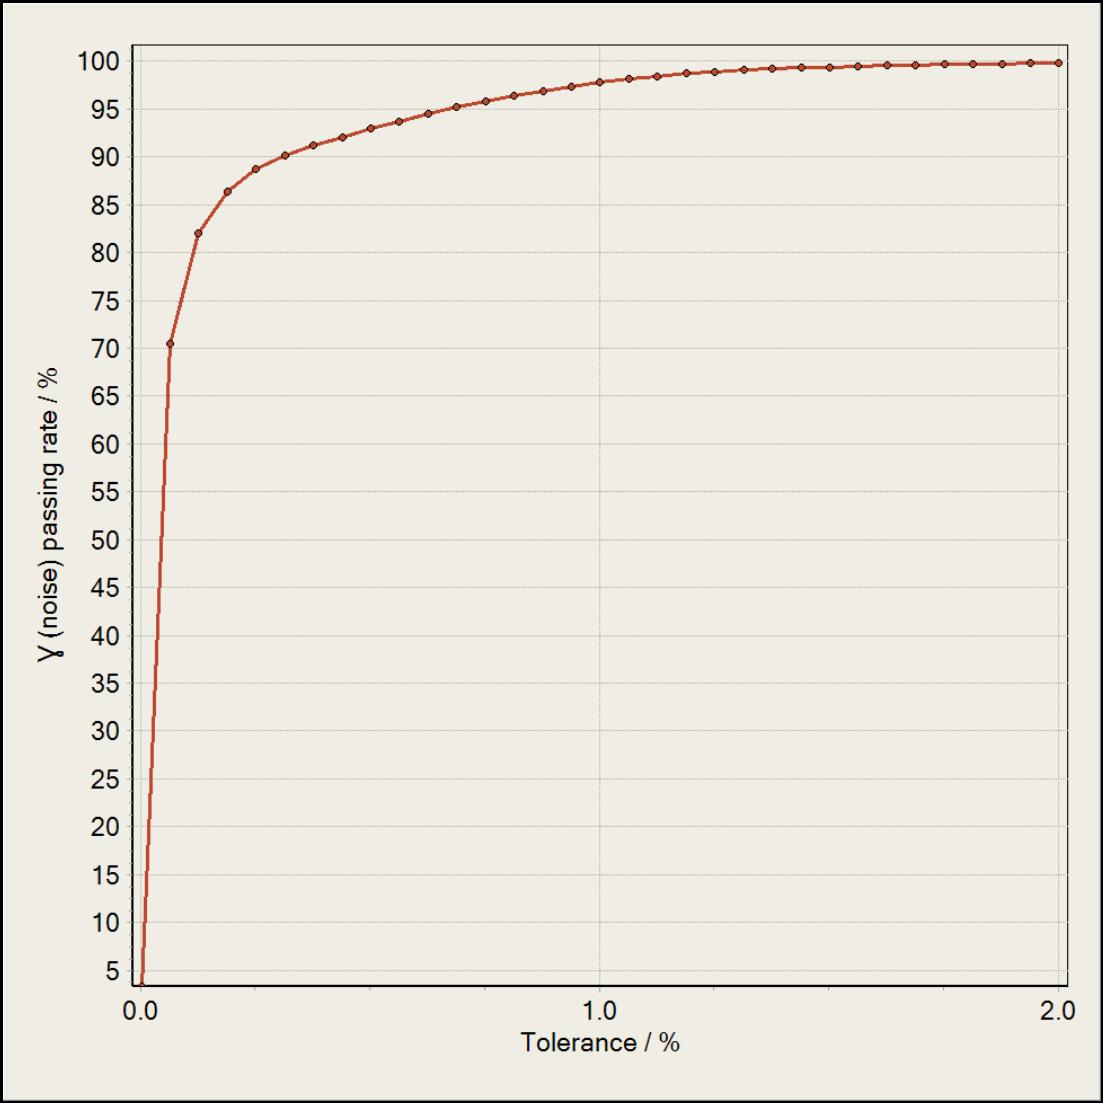
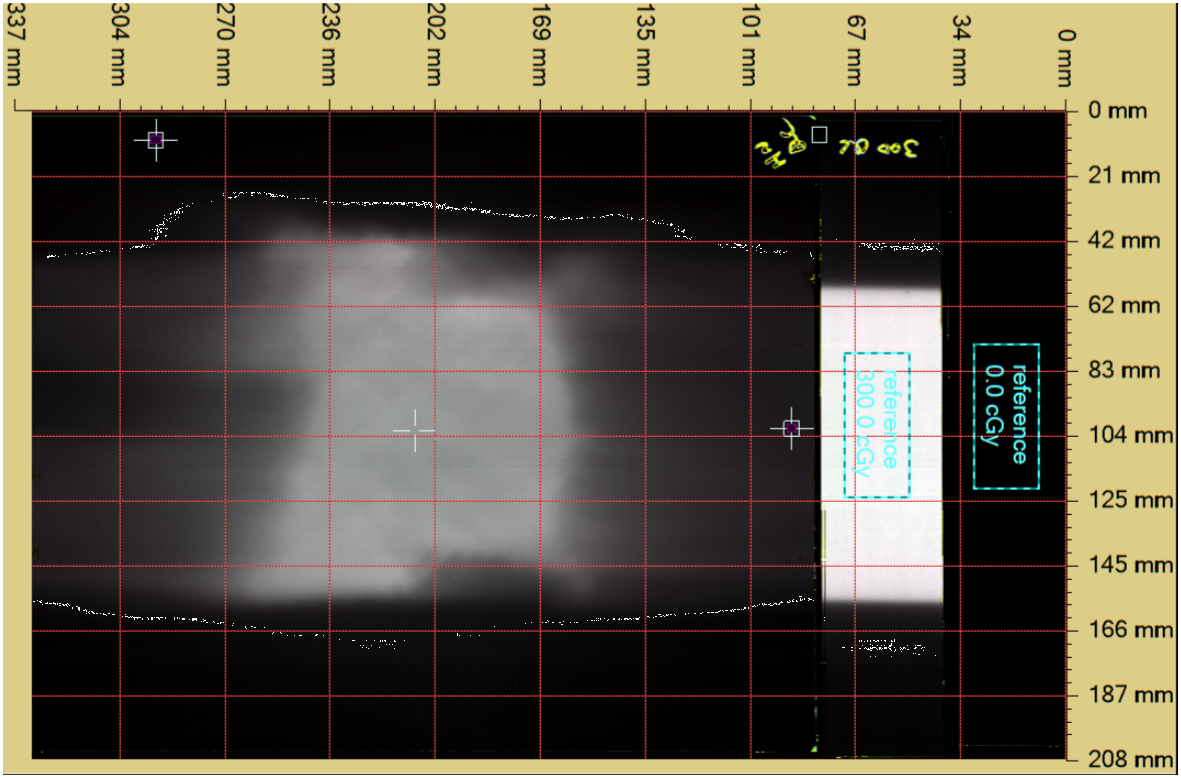
For all calculations on this page the filmQA pro™ example was used which is saved under the name ‘GafChromic phantom Head and Neck’ - the dose field (see below) ranges 0—200 cGy and the treatment plan has a resolution of 25 dpi (1 mm).
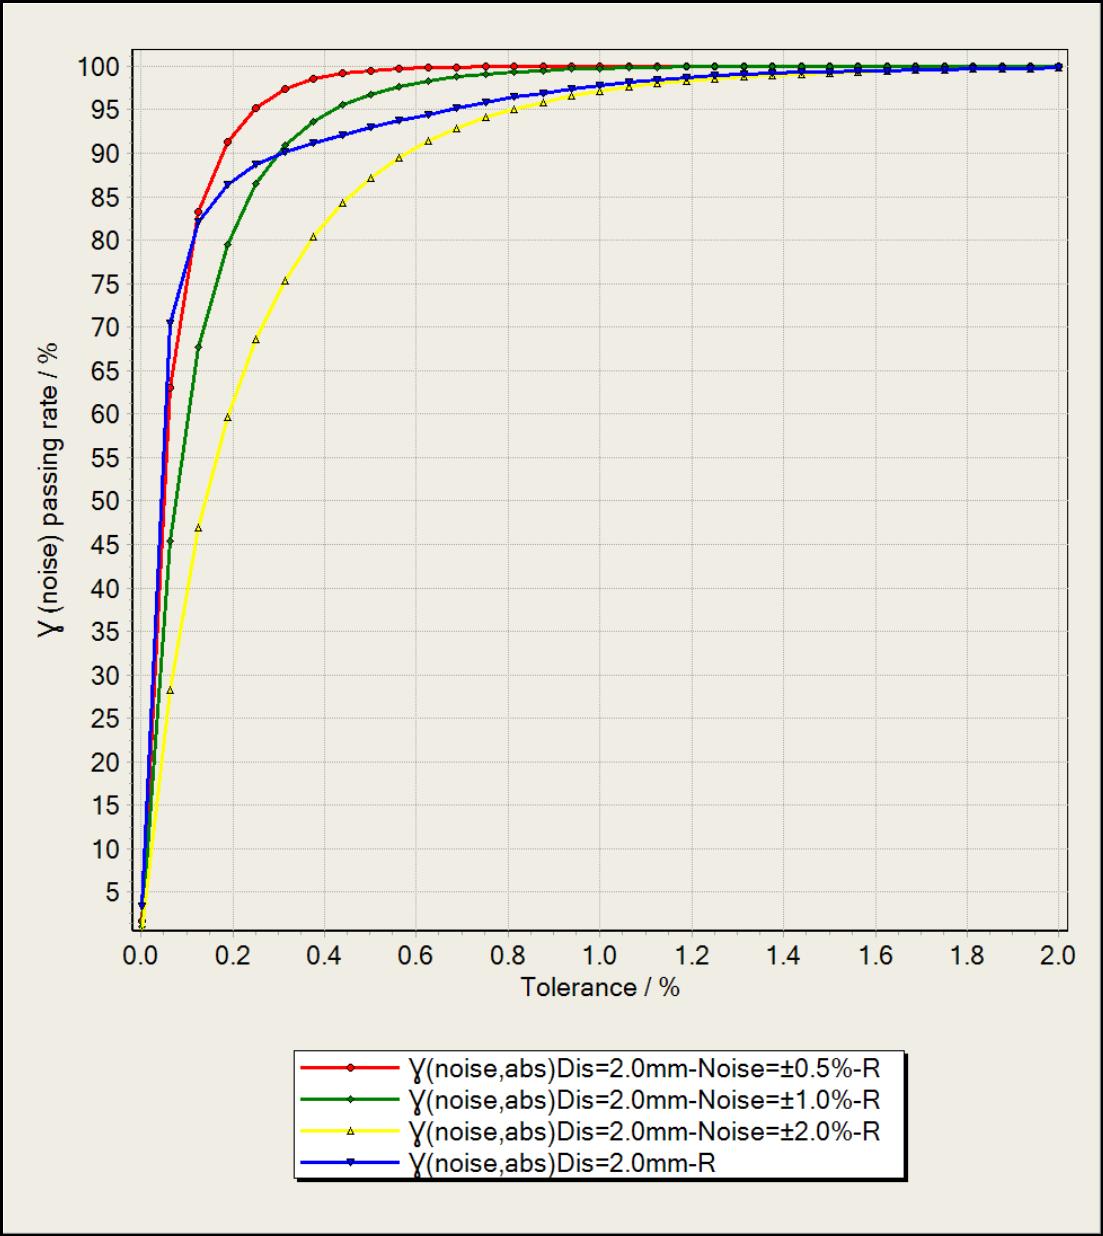
Adding noise to the dose map - 0.5%, 1% and 2% - one obtains the resulting passing rate functions as shown below. Small noise amounts can increase the passing rate substantially and the passing rate might even increase or decrease depending on the used tolerance criterion - in the example below 1% noise (green) shows that behavior.
cause of the gamma map noise dependency
Dose map has usually a higher resolution than the dose map. Due to the registration process the dose map is rotated and shifted compared to the plan as shown in the schematic below.
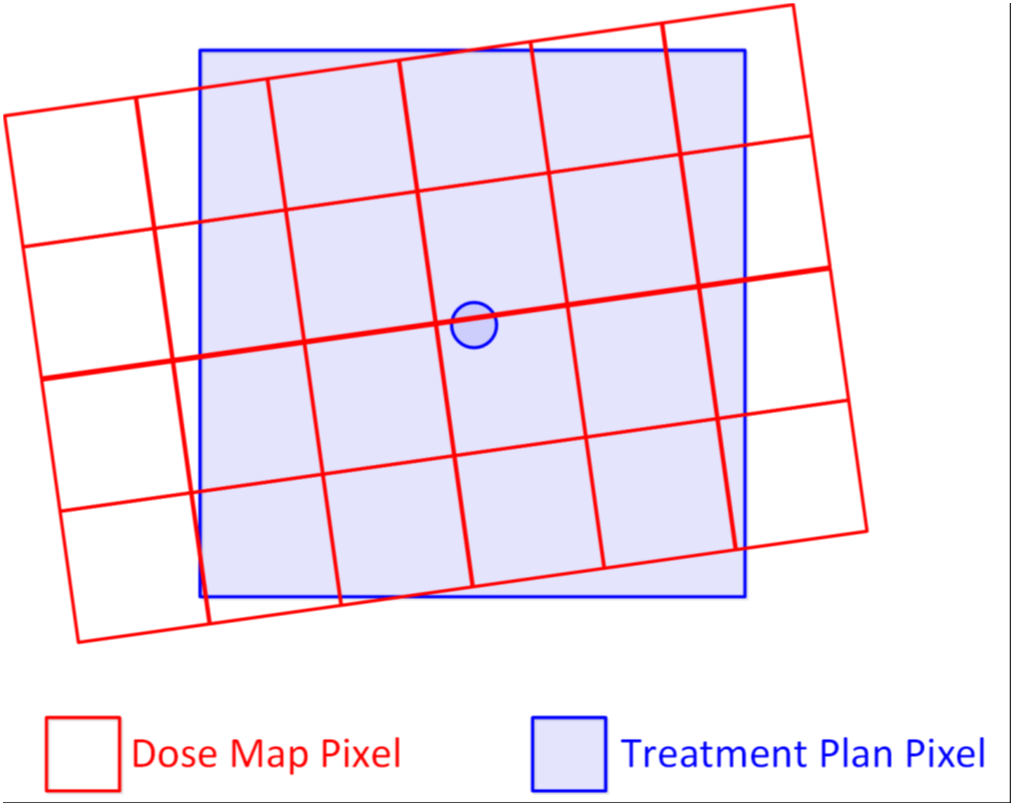
Considering a failing plan pixel and all dose map values (red) are outside the test range, i.e.
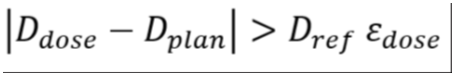
This constellation is shown in schematic below.
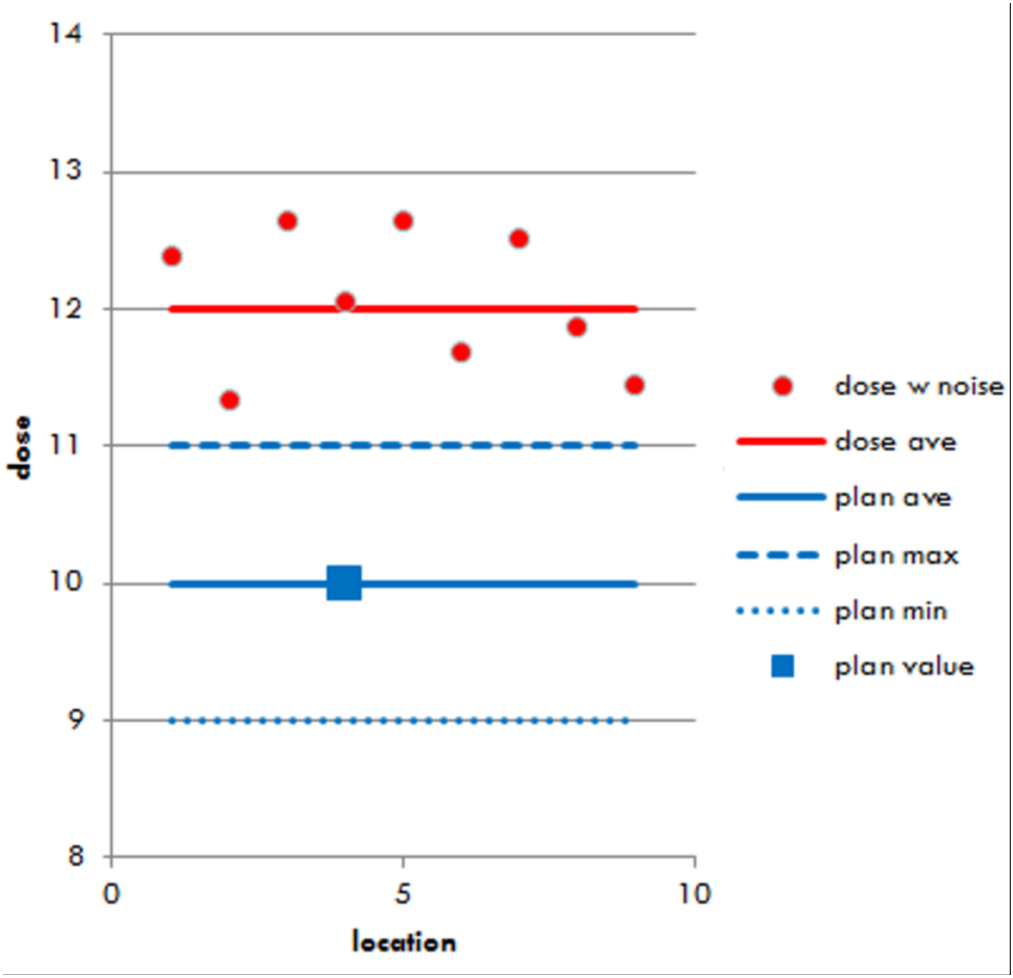
Adding noise to the dose map increases the standard deviation of the already existing dose noise or increasing the resolution of the dose map increases the number of dose points tested (in later case the standard deviation of the noise may be same). When increasing standard deviation of the dose noise or increased number of dose points will at a certain point trigger the test criterion as shown in the drawing below and the original failing plan point is now passing.
This mechanism triggers the increase of the gamma passing rate.
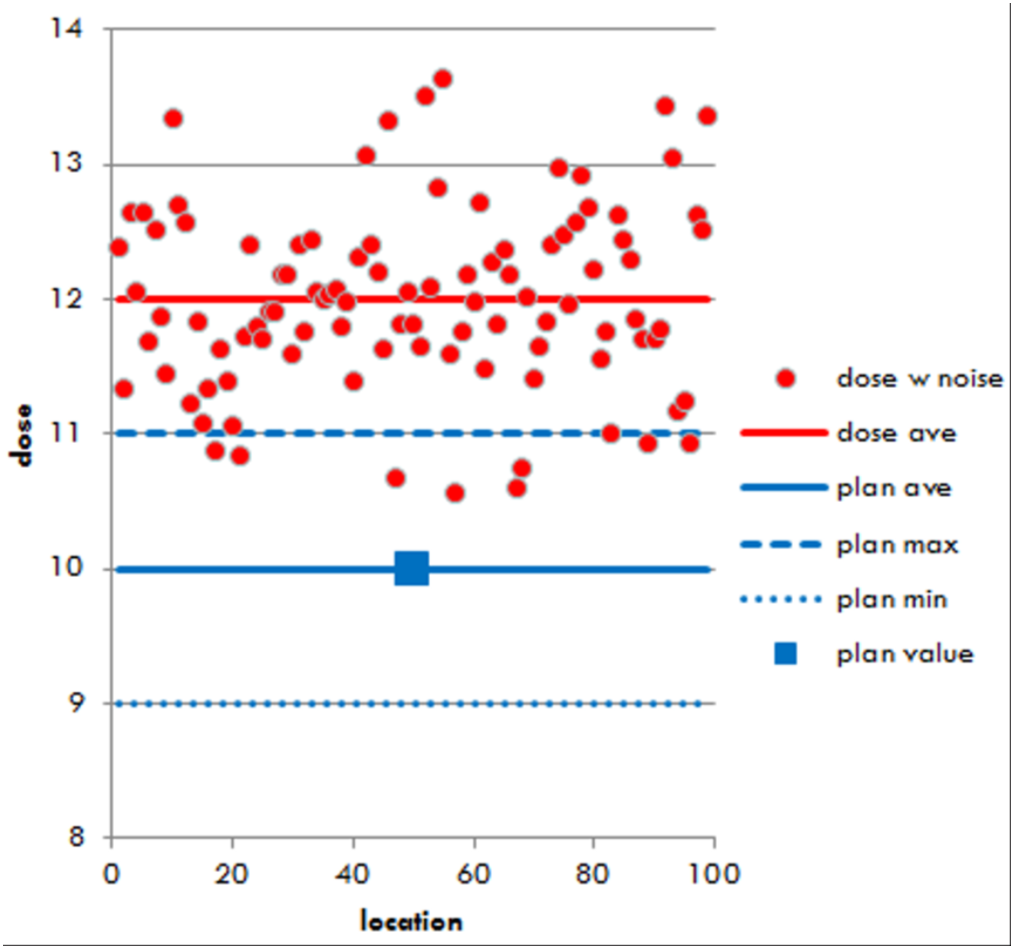
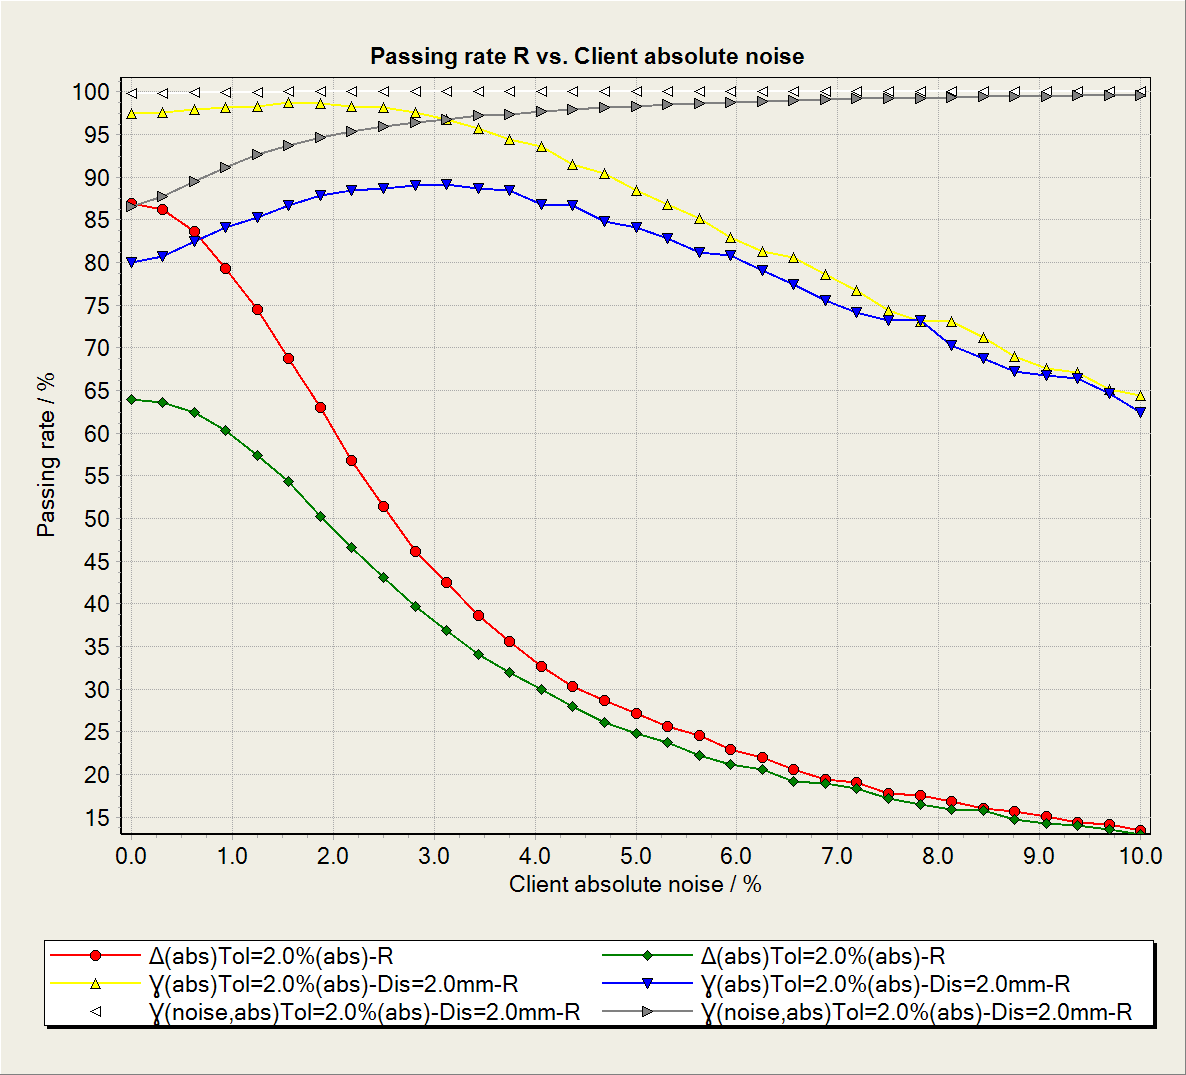
Below the dependency of the passing rate vs noise added to the dose map for best fit at 2 %/2 mm of ΔDnorm (differential comparison, 87.0% ) and γnorm (Gamma map, 99.8%) and positioning of the dose map 2 mm shifted (ΔDnorm 63.9%, γnorm 86.6%).
For Gamma map comparison the passing rate increases when adding noise to the dose map whereas the passing rate of differential comparison decreases. Unfortunately the increase with noise becomes stronger when the is worse (here shift of 2 mm) since in that case more pixels are available that can switch from ‘failed’ to ‘passed’.
reduction of the gamma map noise dependency
If one can assume that the noise in the dose map is none-biased, the average dose across a plan pixel (see red line in above drawings) is not affected neither by the number of dose points (dose map resolution) nor the standard deviation (noise amplitude).
In general, if the dose map is projected to the pixel grid of the treatment plan the dependency of the comparison result can be improved. Such projection can be carried out either by averaging or by interpolation—filmQA pro™ offers this optional.
Similar to above chart, the chart below shows the passing rates for best dose map location and 2 mm offset at 2 %/2 mm illustrating how the dependency on noise is reduced. The gamma map application to the dose map projected at plan grid is the default method used by filmQA pro™ and it symbol is  .
.
Due to the strong noise dependency the non-projected gamma map delivers inflated passing rates and cannot be used to get a realistic estimate for the quality of a delivered dose field. In filmQA pro™ this gamma map is marked as ‘Gamma (no projection, noise dependent) using the symbol 
An alternative way to reduce the noise dependency is to swap the role of plan and dose map (i.e. for each dose map pixel matching plan pixels are verified in the gamma comparison). Since there is practically no noise in a treatment plan, the noise dependency is avoided. This is illustrated in the chart below showing passing rates of projected gamma map and swapped gamma map for best dose map position and 2 mm offset. No noise dependency is visible for the swapped version (this version also uses the projection of the dose map to the pixel grid of the plan).
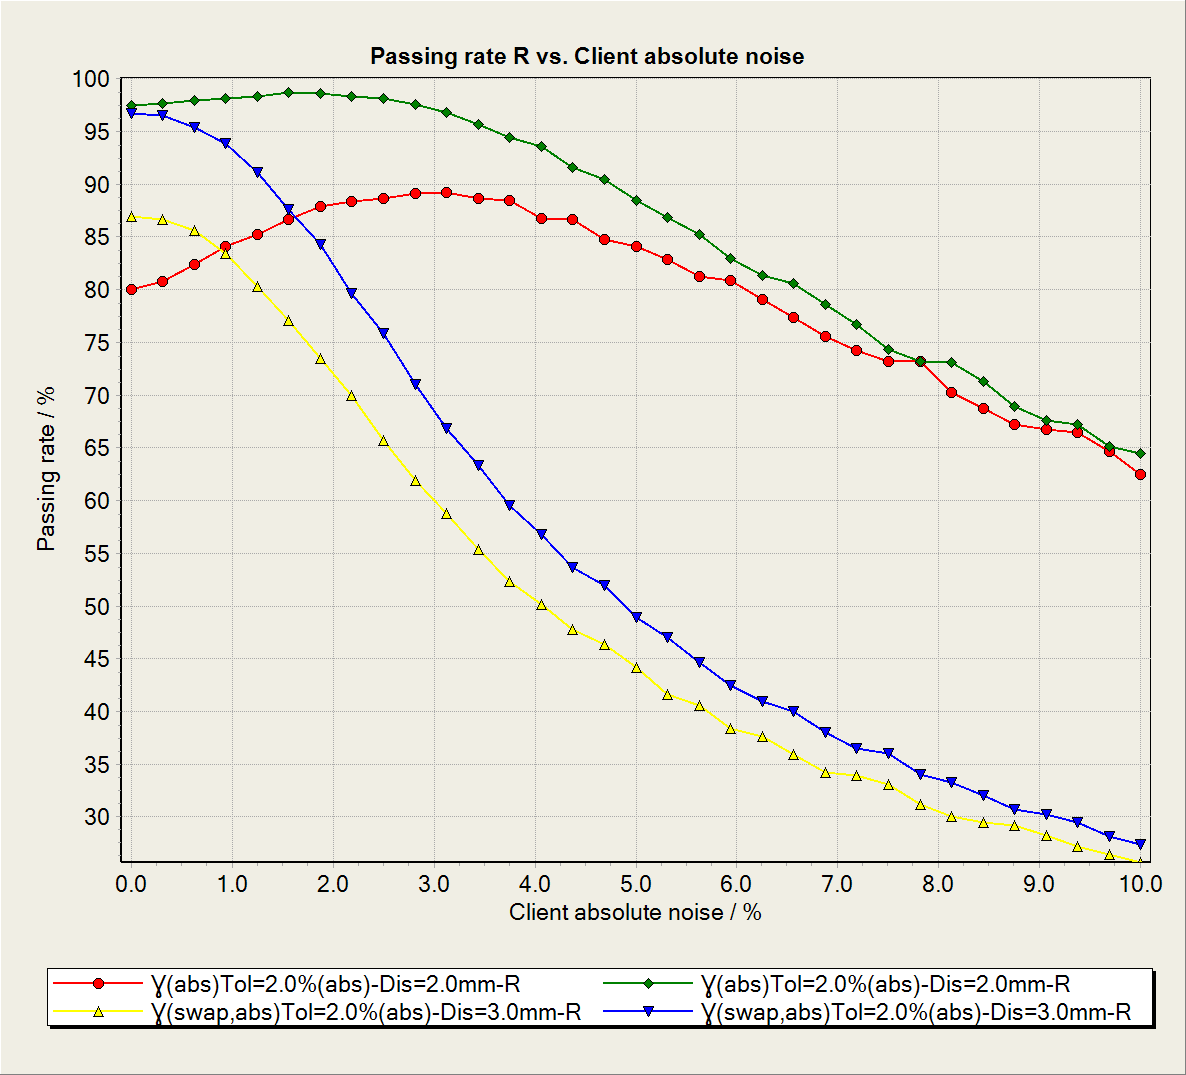
This swapped version of gamma comparison is available in filmQA pro™ as ‘Gamma (swap)’ and carries the symbol  .
.
The passing rates obtained with projected dose map depends on the resolution of the treatment plan used. The chart below shows this dependency for the best fit for projected and non-projected gamma map γnorm as well as the differential map ΔDnorm .
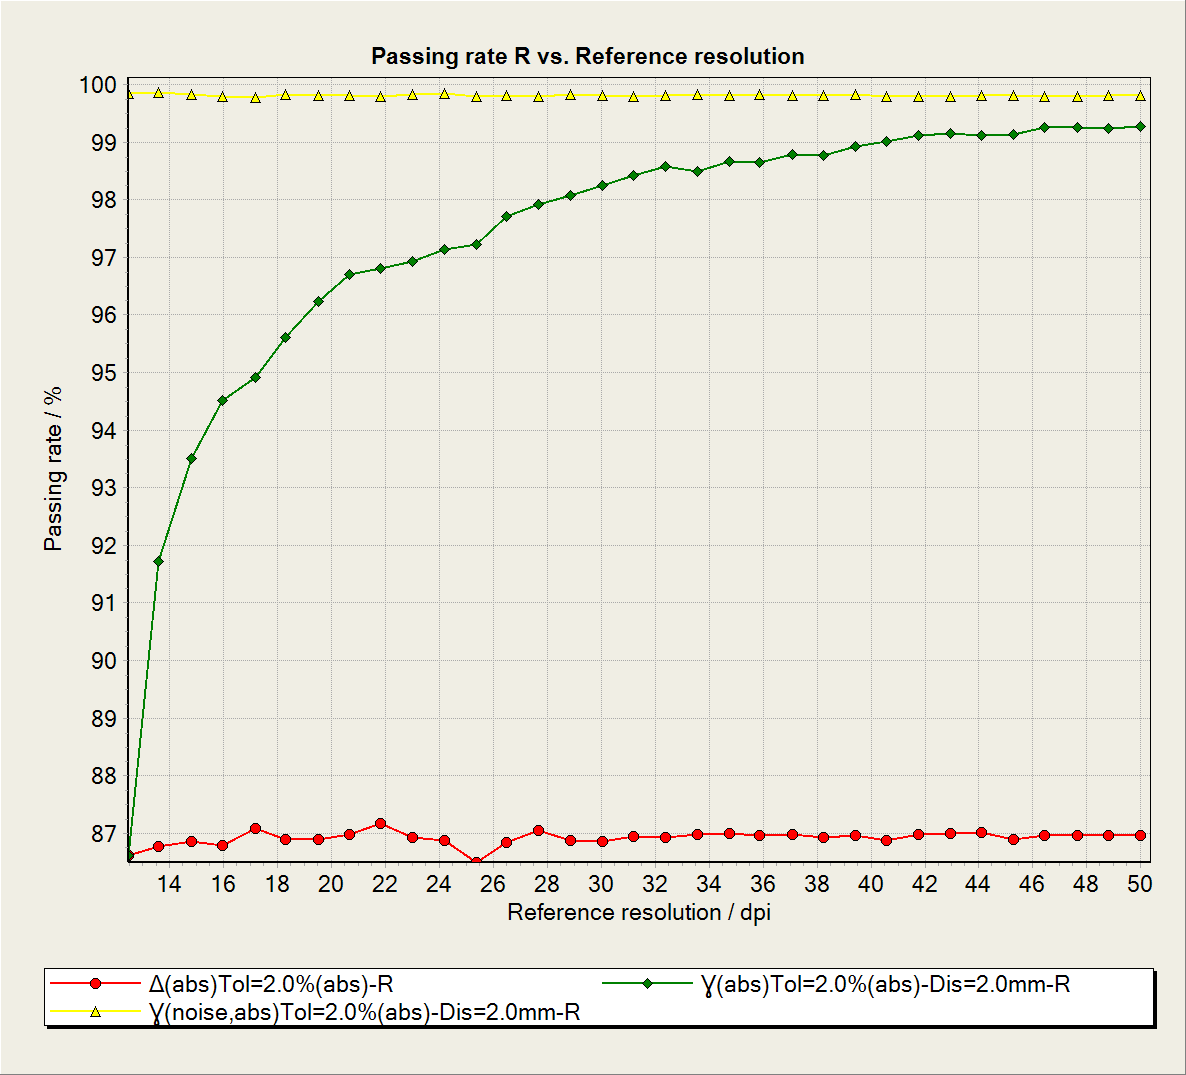
For sufficiently high plan resolution the passing rate of the projected γnorm converges toward the passing rate of the non-projected γnorm and if the plan resolution reaches test distance the projected γnorm delivers a passing rate identical with the differential comparison ΔDnorm. In any case, passing rate obtained at different resolution cannot be compared directly.
read more >